Geo Engine Demonstrator
The Geo Engine FAIR-DS demonstrator realizes multiple use cases that show the capabilities of the NFDI data spaces and address important societal issues like the loss of biodiversity and climate change. Within the FAIR-DS project, the Geo Engine software is extended with FAIR data services and capabilities for data spaces. New dashboards and visualizations are developed to demonstrate added value from the FAIR-DS integration.
Overview of the Geo Engine Platform
Geo Engine is a cloud-ready geo-spatial data processing platform.
It consists of the backend and several frontends.
The backend is subdivided into three subcomponents: services, operators, and data types.
Data types specify primitives like feature collections for vector or gridded raster data.
The Operators block contains the processing engine and operators.
The Services block contains data management and APIs.
It also contains external data connectors, that allow accessing data from external sources.
Here, the connection to the data spaces is established.
Frontends for the Geo Engine are geoengine-ui for building web applications on top of Geo Engine.
geoengine-python offers a Python library that can be used in Jupyter Notebooks.
3rd party applications like QGIS can access Geo Engine via its OGC interfaces.
All components of Geo Engine are fully containerized and Docker-ready. A GAIA-X-compatible self-description of the service is available. Geo Engine builds upon several technologies, including GDAL, arrow, Angular, and OpenLayers.
Aruna Data Connector
The ArunaDataProvider implements the Geo Engine data provider interface.
It uses the Aruna RPC API to browse, find, and access data from the NFDI4Biodiversity data space using the Aruna data storage system.
By performing the translation between the Aruna API and the Geo Engine API, the connector allows to use data from the NFDI4Biodiversity data space in the Geo Engine platform.
This makes it possible to integrate the data easily into new analyses and dashboards.
Copernicus Data Space Ecosystem
To show cross data space capabilities and to generate insightful results, the Geo Engine demonstrator is connected to the Copernicus Data Space. It uses the SpatioTemporal Asset Catalog (STAC) API and an S3 endpoint to generate the necessary meta data to access Sentinel data. Users can then access the Sentinel data as proper data sets and time series, rather than just as individual satellite images. This enables temporal analysis and the generation of time series data products.
Machine Learning Pipeline
The Demonstrator leverages Geo Engine's machine learning pipeline. It allows streaming data from the Geo Engine to Python and train a model. The model can then be uploaded and registered in the backend and then used as an operator to predict new and unseen data.
ECOMETRICS Dashboard
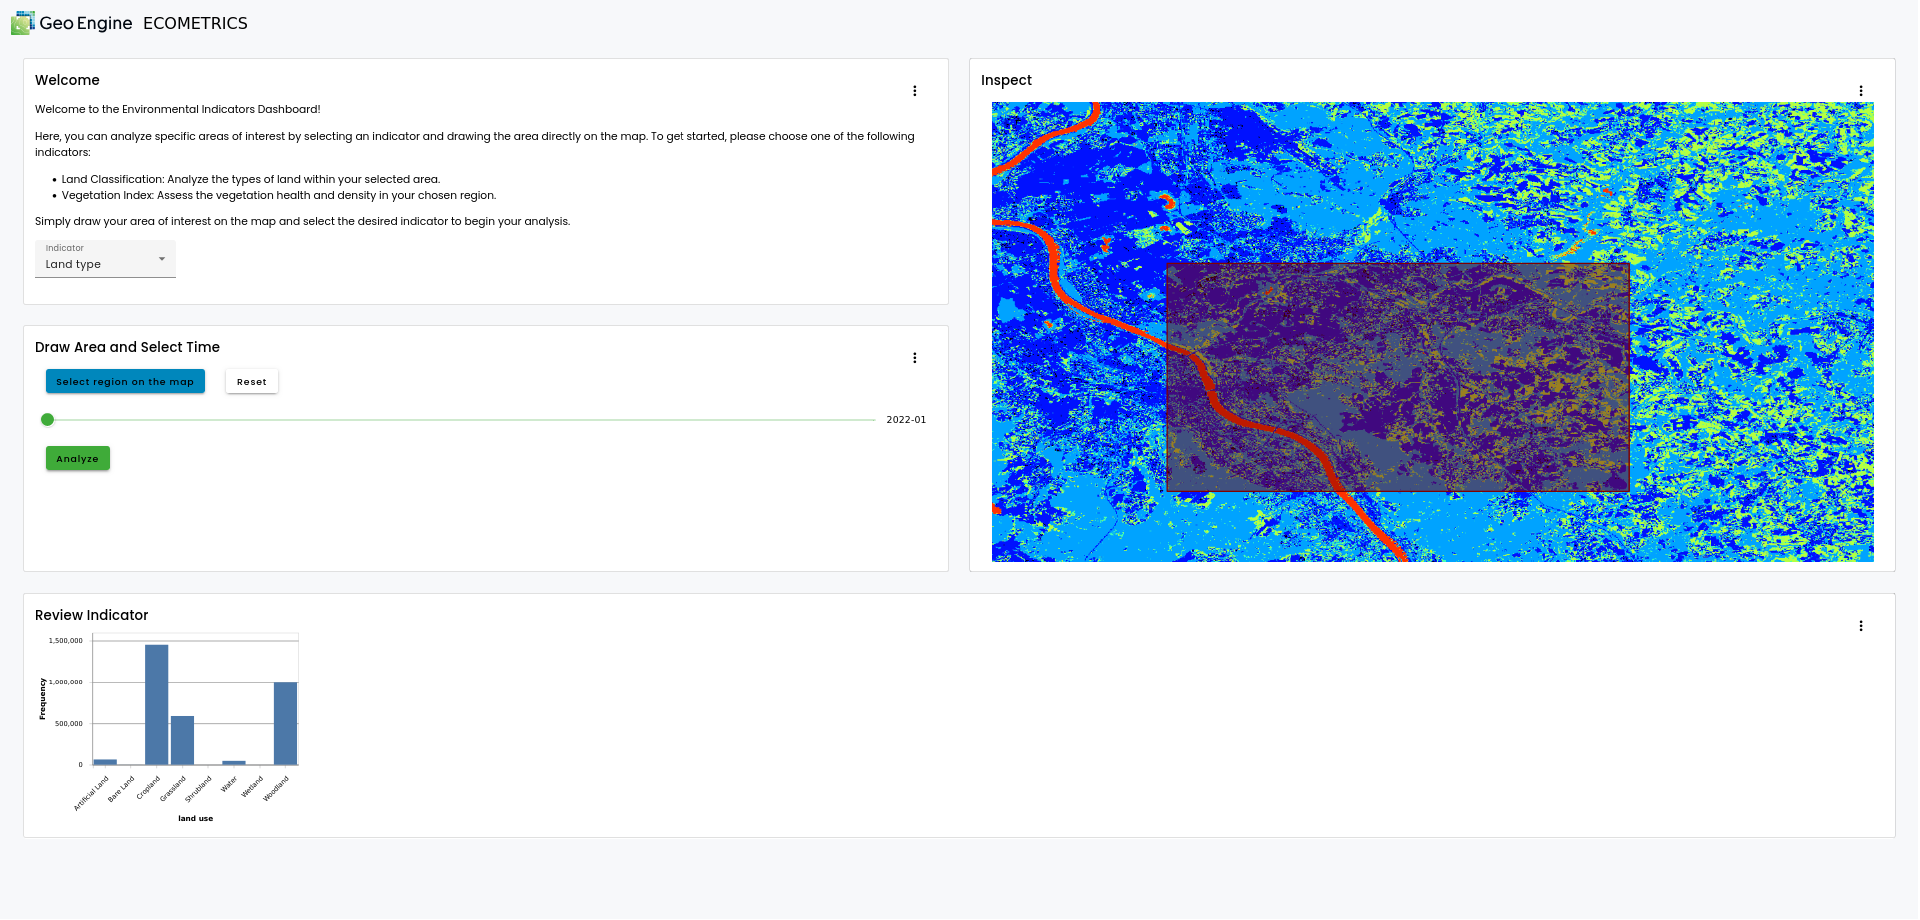
The ECOMETRICS dashboard is a custom app developed for FAIR-DS. It allows the user to visualize and analyze an ecological indicator, like vegetation or land use. The demonstrator consists of two parts. The UI is the user-facing part of the application while the indicator generation happens on the backend.
UI (Dashboard)

As visible in the screenshot, the ECOMETRICS app consists of four components. The top left explains how the app works and lets the user select the ecological indicator. Upon selection, the indicator will be visualized on the map on the right. The user can then select a region of interest by drawing on the map and selecting a point in time on a slider. The region will be intersected with the indicator. Finally, the user can review the results in the bottom-most section of the app on a plot. In case of a continuous indicator like vegetation, the plot will show a histogram. In case of a classification indicator like land use, the plot will show a class histogram.
Indicator generation
An indicator for the ECOMETRICS app is a raster time series that is either continuous or a classification.
Currently, there are two indicators available: NDVI and land use.
Both indicators are built from Sentinel data.
The NDVI, short for Normalized Difference Vegetation Index, is computed by aggregating all Sentinel tiles for a given year and by computing (A-B)/(A+B) where A is the near infrared channel and B is the red channel.
The necessary data is provided by Geo Engine's Copernicus Data Space Ecosystem Connector.
Machine Learning
The land use indicator is created by training a machine learning model. The training process incorporates the Sentinel data and uses the land use and land cover survey (LUCAS) as ground truth. While the Sentinel data are again retrieved from the Copernicus Data Space, the LUCAS data are used via the Aruna data connector. In principle, any data accessible using the Aruna data connector can be used for machine learning with Geo Engine.
The model is trained in a Jupyter notebook that defines a Geo Engine workflow, feeds the resulting data into a machine learning framework, trains the model, and registers it with the Geo Engine. The workflow applies feature engineering on the data and re-arranges it via timeshift operations This gives the classifier the temporal development for each training pixel at once and allows learning the different land usage types.
Value Proposition
The demonstrator shows the benefits of FAIR Data Spaces for science and industry. By linking data from different sources and applying ML methods, new insights can be gained and innovative applications developed. It showcases a system that connects data from science and industry across data spaces, applying it through machine learning while adhering to FAIR principles.
Benefits:
- For industry: The system enriches existing datasets with publicly available data and provides direct access to modern analysis frameworks using machine learning. This allows for direct data use, easy reuse of data and models, and avoids redundant calculations. A concrete example is combining observational and climate data with machine learning for biodiversity reporting, such as property classification.
- For research: The system showcases the relevance of research data through transparent provenance and workflows. This facilitates funding applications and fosters collaboration between research institutions and companies, which is increasingly required by funding agencies.
Contribution to FAIR Data Spaces
The demonstrator contributes to the advancement of FAIR Data Spaces by scaling FAIR principles to broader data ecosystems and diverse sectors. It aims to create sustainable and efficient data infrastructures that support cross-sectoral data exchange and promote interoperability and the use of data standards through use cases that provide real benefits for science and industry. yy
ESG Indicator and Virtual Data Trustees
The ESG Indicator demonstrator provides companies with concrete data to assess their environmental impact, streamlining one step of the process of creating quantitative figures in ESG reports. By leveraging research data to develop practical models, it fosters collaboration between academia and industry. The demonstrator outlines incentives for the development of new applications in the fields of artificial intelligence and geospatial data, contributing to technological advancements and sustainable solutions.
Data Trustee

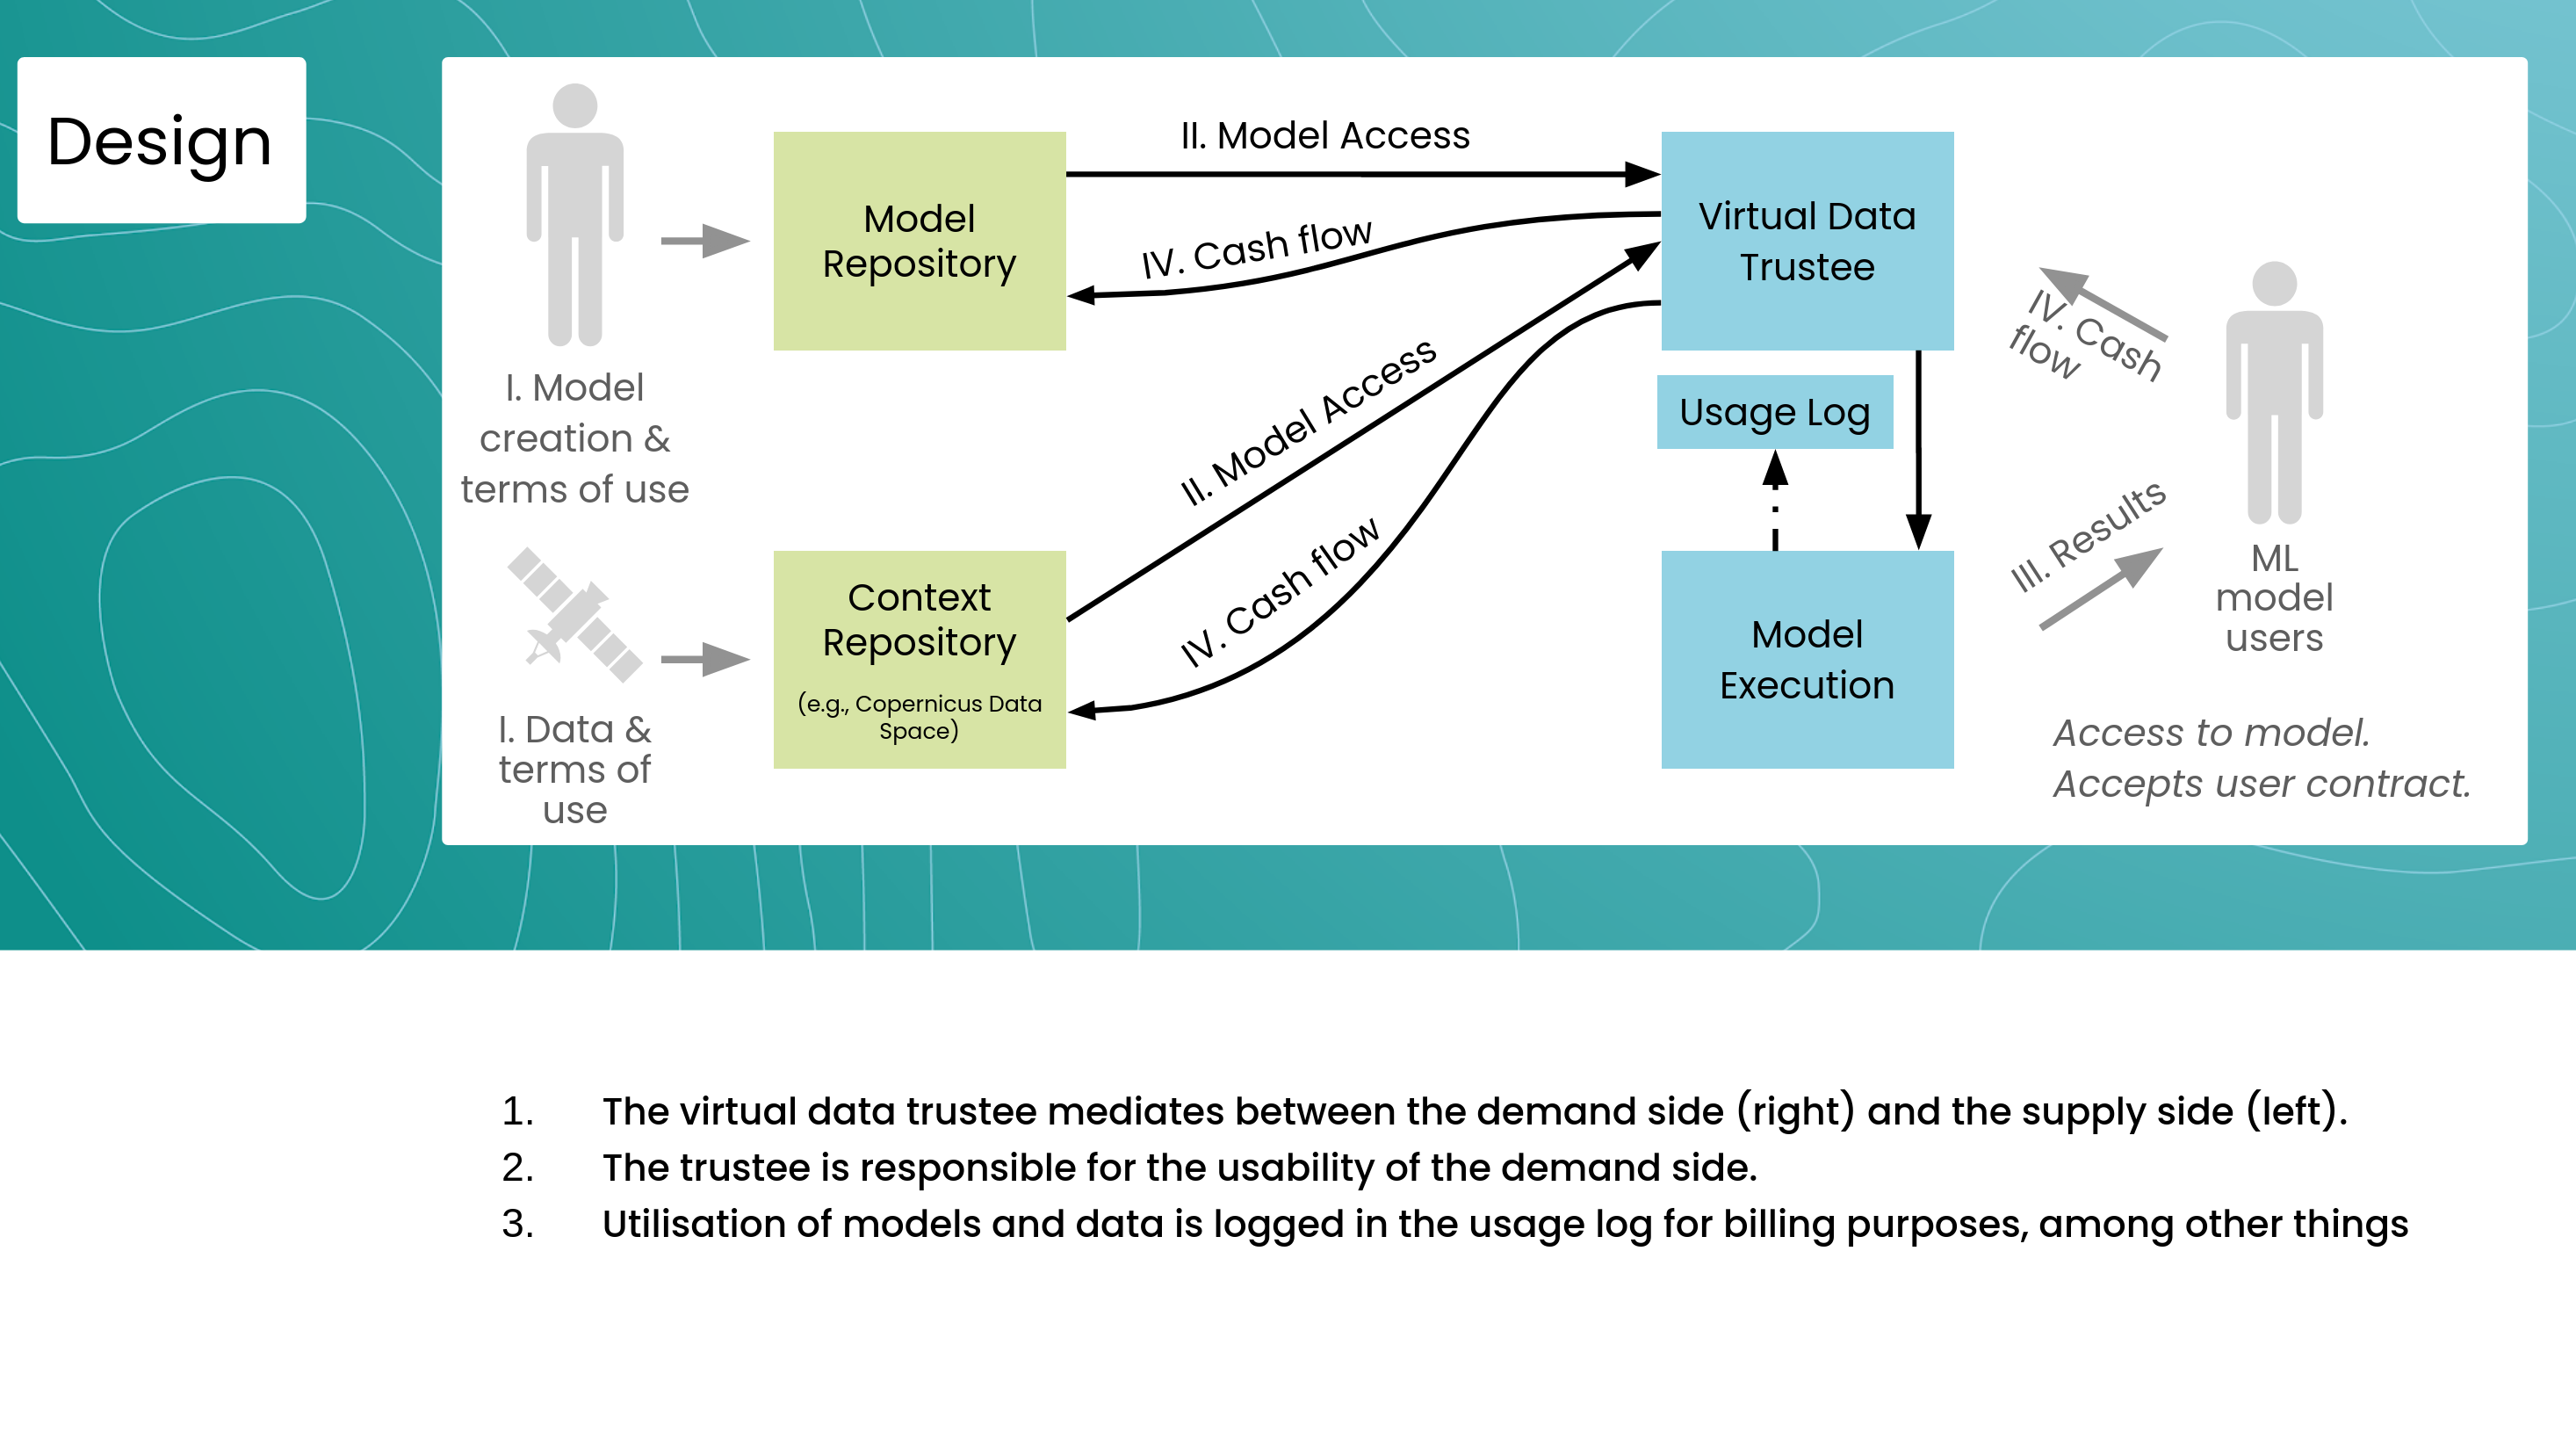
The diagram illustrates a virtual data trustee model, where the trustee acts as an intermediary between data suppliers and data consumers, in this case research institutions and industry companies. The data supplier provides models and data, while the data consumer accesses and utilizes these resources. The trustee ensures the usability of the data and models for the consumer, logs usage for billing and reproducibility, and facilitates the exchange of data and models between the three data spaces. This model promotes efficient and secure data sharing and utilization.
UI (Dashboard)

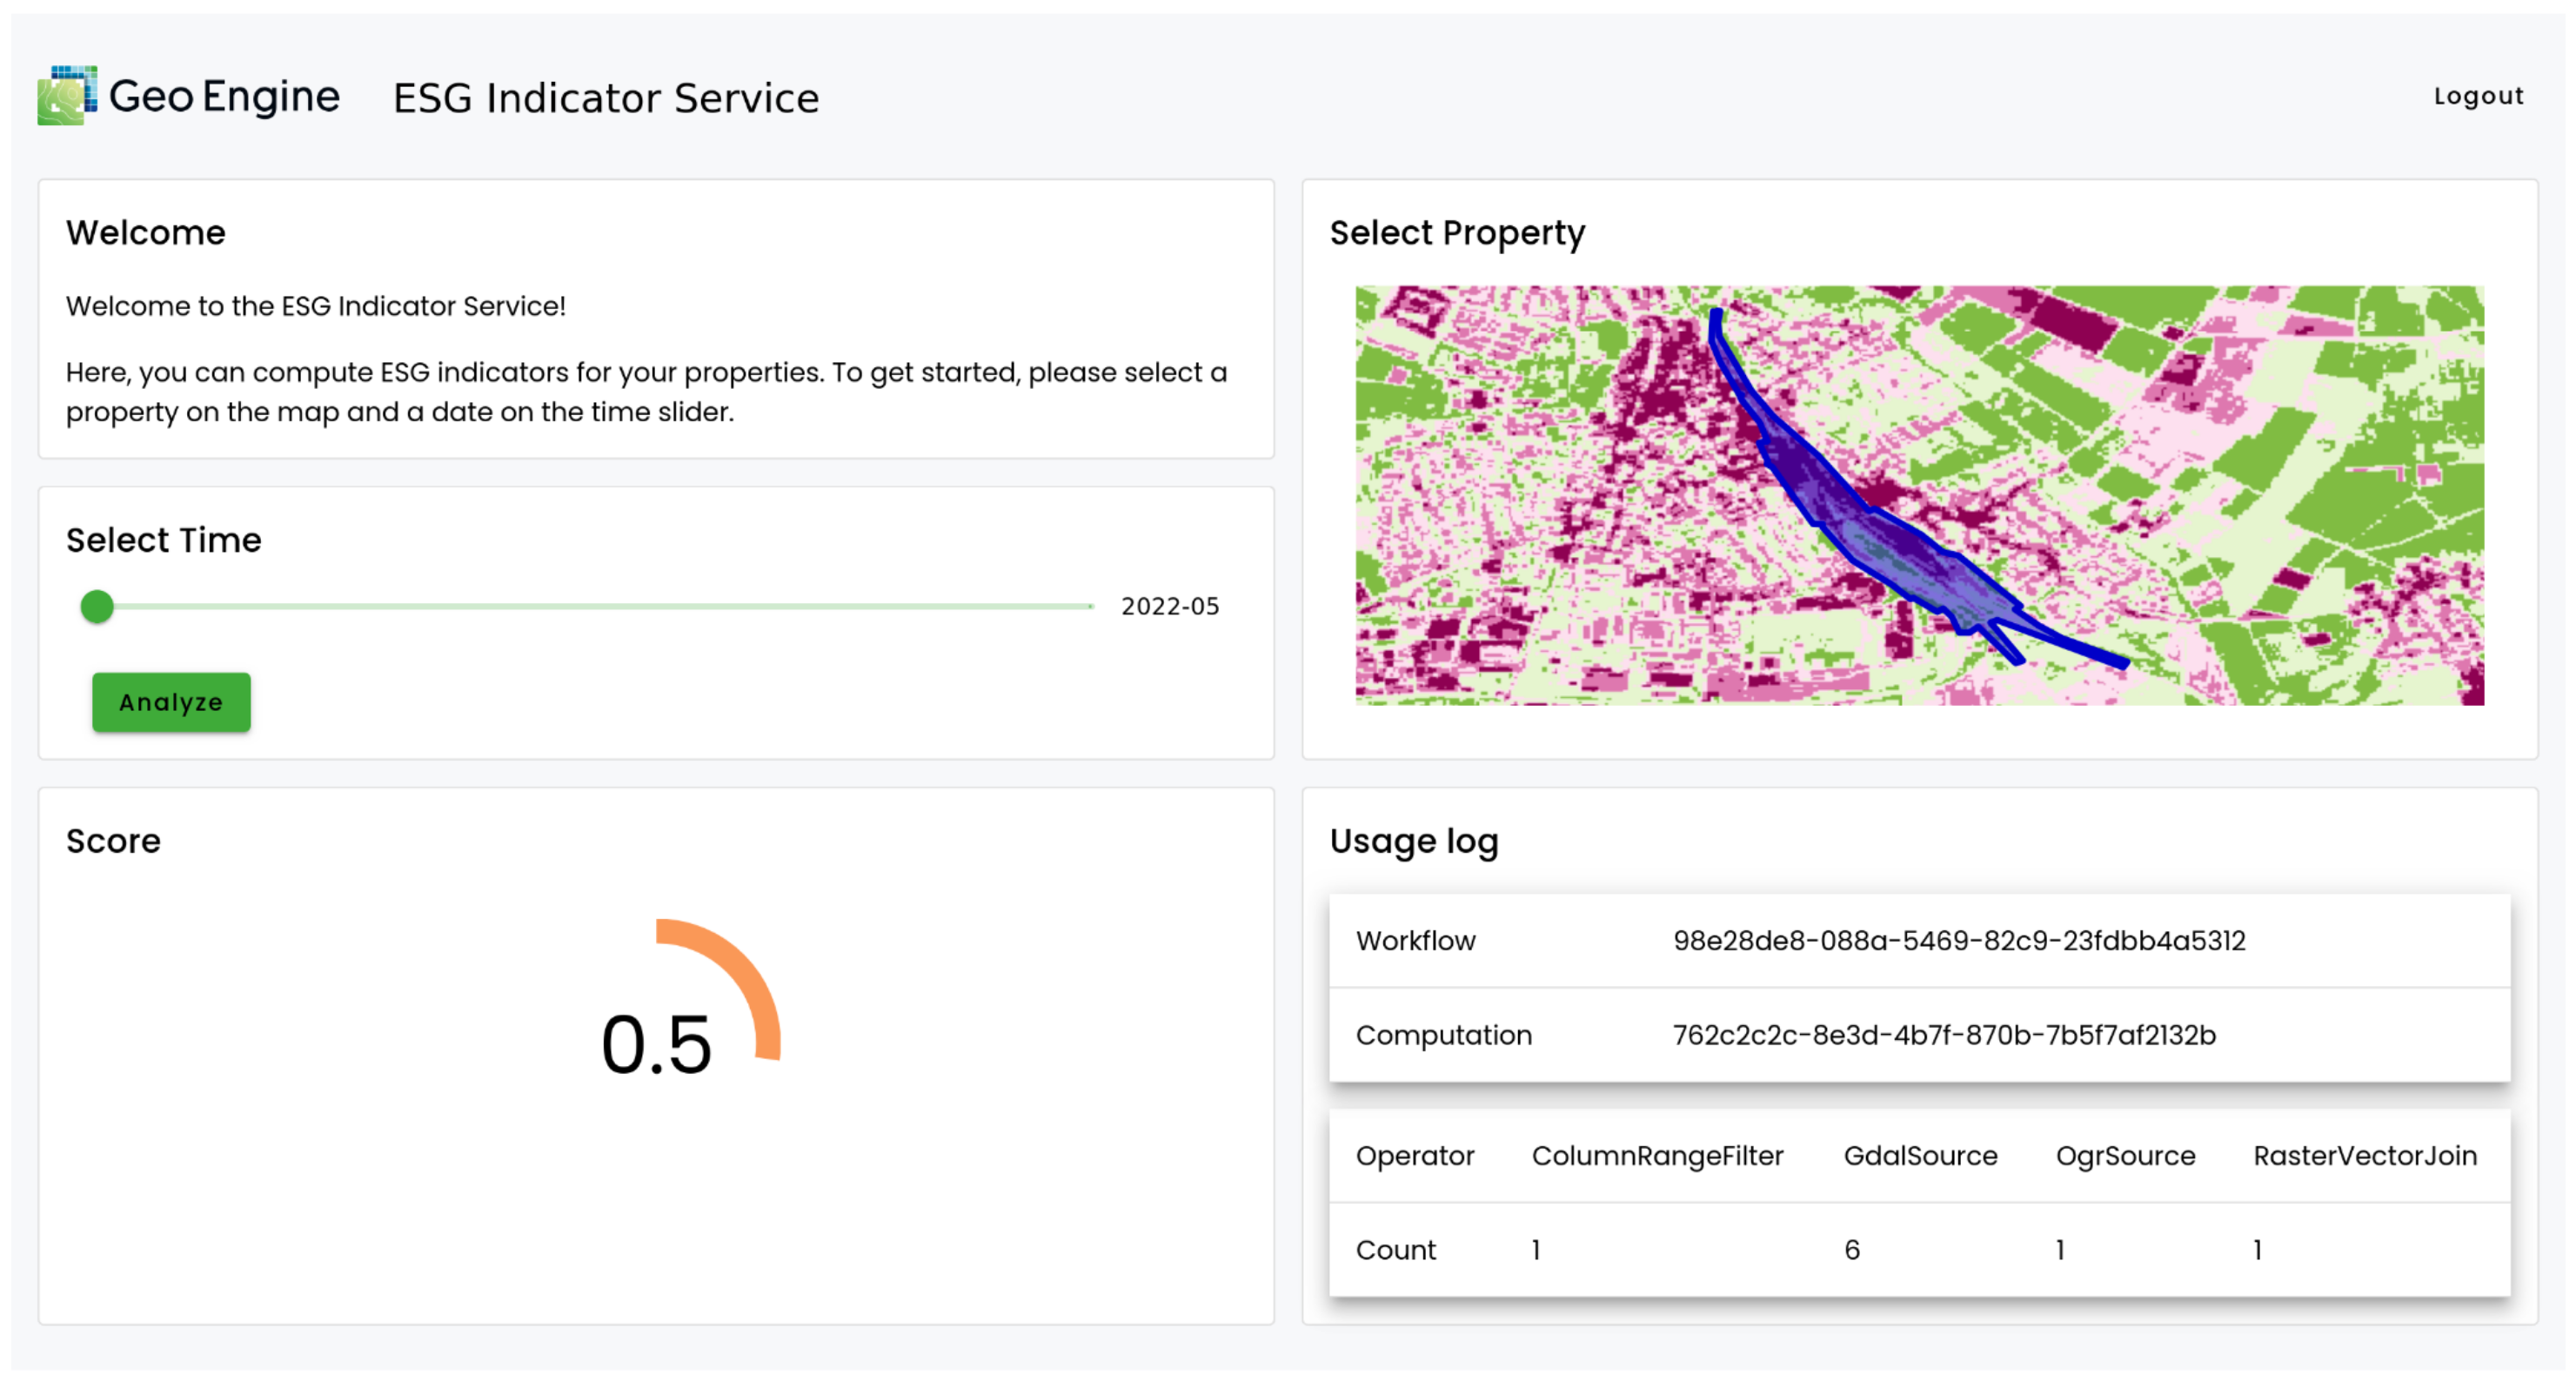
The UI provides a user-friendly interface for calculating an ESG (Environmental, Social, and Governance) indicator for specific properties. Users can select a property on a map, specify a date range using a time slider, and initiate the analysis process. The calculated ESG score is displayed visually, and detailed usage logs are available for transparency. This tool empowers users to assess the sustainability performance of properties over time.
ML-based Indicator

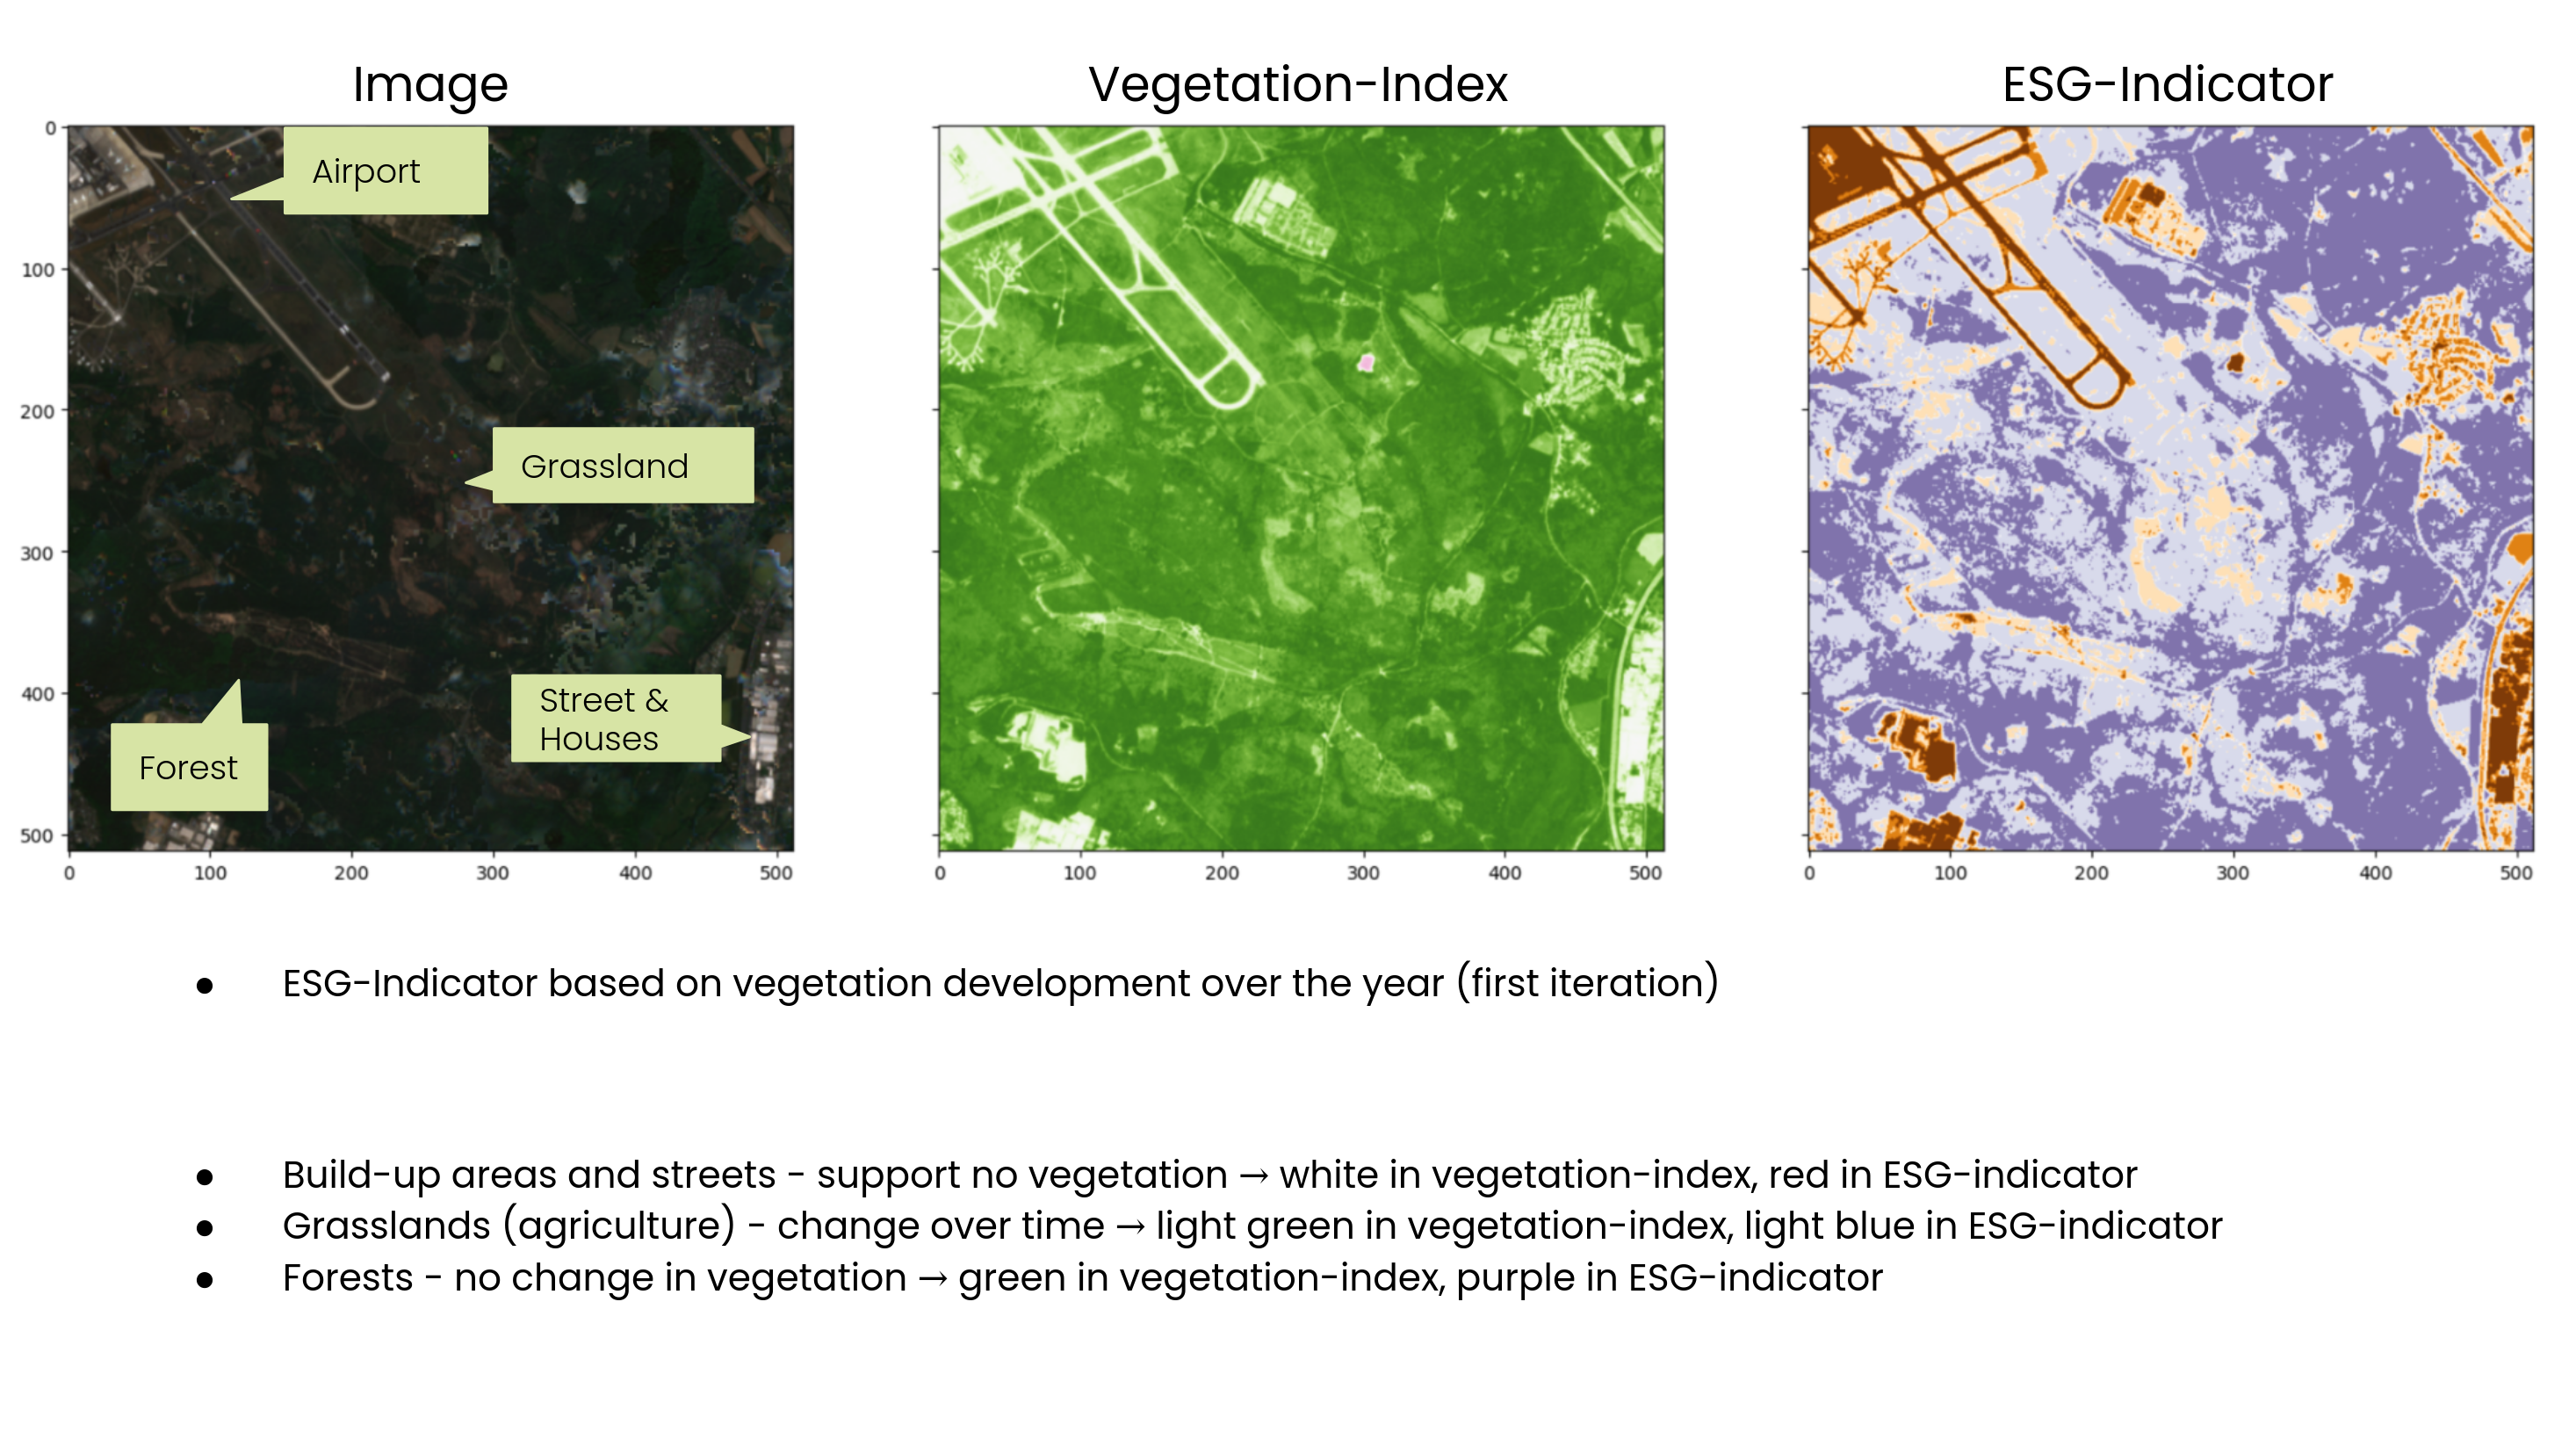
The biodiversity indicator shown in the image assesses the vegetation within a given area over time. It utilizes a vegetation index (NDVI) to track changes in vegetation cover, with different colors representing various land cover types. For example, built-up areas and streets, that support no vegetation, are depicted in white in the vegetation index and red in the ESG indicator. Grasslands, which exhibit seasonal changes, appear light green in the vegetation index and light blue in the ESG indicator. Forests, with stable vegetation cover, are represented by green in the vegetation index and purple in the ESG indicator. This indicator provides valuable insights into the biodiversity and ecological health of a region, contributing to quantitative ESG reporting.
Value Proposition
This demonstrator establishes a virtual data trustee that connects data from industry (with DB as a pilot user), the space sector (Copernicus Data Space Ecosystem), and science (NFDI4Biodiversity-RDC). This data trustee acts as a secure intermediary, facilitating access to data from these different domains while upholding FAIR-DS principles.
Benefits
- Enhanced Collaboration: The demonstrator has the potential to foster collaboration between industry and research in the field of biodiversity analysis. By connecting industrial data spaces to research data infrastructure, companies like Deutsche Bahn can benefit from the data and analytical methods available, while research institutions can improve their models and gain new insights through access to industrial data.
- Mutual Gains for Research and Industry: Access to a broader range of data leads to improved analyses and models. Both sides can define data access and control the use of their own data. Practical Applications: The data trustee enables the creation of operational services, such as ESG reporting metrics, which can be used by industry. For research, it increases visibility and funding opportunities.
Addressing data confidentiality, particularly for sensitive information like location data, is a key concern. The data trustee allows derived data and products to be shared without revealing the original data. Provenance tracking ensures transparency and proper attribution of data sources.
By using a virtual data trustee, the demonstrator aims to enhance FAIR-DS principles, incentivize the use of data spaces, and address the needs of various stakeholders. It anticipates that the demonstrator can serve as a foundation for developing further applications in ESG reporting and biodiversity analysis, with the data trustee concept enabling the secure and trustworthy processing of sensitive data.