
FAIR Dataspaces is a BMBF-funded project that aims to bridge the gap between research and industry-related data infrastructures. This is primarily done by combining data infrastructures from the German research data infrastructure (NFDI) with industry driven standards established by Gaia-X.
FAIR Dataspaces is made up of legal and technical experts from academia and industry, and aims to identify ways in which existing data infrastructures can be linked to create added value for the scientific and industrial communities.
Getting started
FAIR-DS uses a few core building blocks to enable data exchange.
- Federated catalog to register all available connectors and assets this is done via the W3C recommended DCAT Catalog vocabulary.
- Negotiation of data exchange is done via the Dataspace Protocol that allows for souvereign data exchange between independent dataspace participants.
Goals of the project
- Connecting communities from NFDI, EOSC and Gaia-X.
- Explore the ethical and legal frameworks needed for data exchange between research and industry
- Demonstrate the use and benefits of Gaia-X technologies across different sectors of academia and industry.
Demonstrators
Demonstrators have been developed to show the possible interactions between different data infrastructures. These include:
FAQ
What is a dataspace ?
A data space is a distributed data system based on common guidelines and rules. The users of such a data space can access the data in a secure, transparent, trustworthy, simple and standardized manner. Data owners have control over who has access to their data and for what purpose and under what conditions it can be used. These data spaces enable digital sovereignty, as the data remains in the possession of the company or research institute until it is retrieved.
What technologies are used ?
FAIR Dataspaces relies on many primarily cloud focused technologies for more information see the technologies section of this book.
License
This work is licensed under a Creative Commons Attribution-NoDerivs 4.0 International License.

Technologies in FAIR Dataspaces
FAIR DS relies heavily on modern cloud-based data infrastructures. Many deployments are powered by the de.NBI cloud, one of Germany's largest community clouds.
Most deployments are done utilizing Containers in a Kubernetes environment.
Example messages for the EDC Connector
Example messages for the EDC connector
Data exchange with the EDC connector follows the specification of the International Dataspace Protocol.
Reading data from a data source is a stepwise process that initially requires the provider of the data to make it discoverable to consumers of the data space.
Once consumers have discovered the published asset, they can negotiate to fetch the data.
- Create asset [PROVIDER]
- Create policy [PROVIDER]
- Create contract [PROVIDER]
- Fetch catalog [CONSUMER]
- Negotiate contract [CONSUMER]
- Get contract agreement ID [CONSUMER]
- Start the data transfer [CONSUMER]
- Get the data [CONSUMER]
- Get the data address [CONSUMER]
- Get the actual data content [CONSUMER]
The workflow above is called Consumer-PULL in the language of the Eclipse Data Components. It is the consumer who initializes the data transfer, and finally fetches (pulls) the data content as the last step.
The examples below were extracted from the documentation about the EDC samples applications.
The prerequisites documentation describes how to build and run the EDC connector as consumer or provider. Our startup configuration determines if it is consumer or provider. Both share the same source code.
Once a consumer and a provider are running, you can establish a data exchange via HTTP with a REST endpoint as data source using the following steps.
In the examples below, consumer and provider are running on the same machine. The consumer listens to ports 2919x and the provider listens to ports 1919x.
1. Create asset [PROVIDER]
curl -d @path/to/create-asset.json -H 'content-type: application/json ' http://localhost:19193/management/v3/assets -s | jq
create-asset.json
{
  "@context": {
    "@vocab": "https://w3id.org/edc/v0.0.1/ns/"
  },
  "@id": "myAsset",
  "properties": {
    "name": "REST endpoint",
    "contenttype": "application/json"
  },
  "dataAddress": {
    "type": "HttpData",
    "name": "myAssetAddress",
    "baseUrl": "https://path.of.rest/endpoint",
    "proxyPath": "true",
    "proxyMethod": "true",
    "proxyBody": "true",
    "proxyQueryParams": "true",
    "authKey": "ApiKey",
    "authCode": "{{APIKEY}}",
    "method": "POST"
  }
}
baseUrl is the URL of the REST endpoint, It is the data source from where the data will be finally fetched.
proxyPath, proxyMethod, proxyBody, proxyQueryParams are flags that allow a provider to behave as a proxy that forwards requests to the actual data source.
In the example above, the provider will be a proxy for the consumer. The provider will fetch the data from the data source. The REST call from the provider to the data source will use the value of authKey as part of its header, toghether with the value of authCode as the token.
The secret token is known to the provider but not to the consumer.
Example Response
{
  "@type": "IdResponse",
  "@id": "myAsset",
  "createdAt": 1727429239982,
  "@context": {
    "@vocab": "https://w3id.org/edc/v0.0.1/ns/",
    "edc": "https://w3id.org/edc/v0.0.1/ns/",
    "odrl": "http://www.w3.org/ns/odrl/2/"
  }
}
2. Create policy [PROVIDER]
curl -d @path/to/create-policy.json -H 'content-type: application/json' http://localhost:19193/management/v3/policydefinitions -s | jq
create-policy.json
{
  "@context": {
    "@vocab": "https://w3id.org/edc/v0.0.1/ns/",
    "odrl": "http://www.w3.org/ns/odrl/2/"
  },
  "@id": "myPolicy",
  "policy": {
    "@context": "http://www.w3.org/ns/odrl.jsonld",
    "@type": "Set",
    "permission": [],
    "prohibition": [],
    "obligation": []
  }
}
Thre policy above does not specify special permissions, prohibitions, or oblogations. By default, all access is allowed.
Example response
{
  "@type": "IdResponse",
  "@id": "myPolicy",
  "createdAt": 1727429399794,
  "@context": {
    "@vocab": "https://w3id.org/edc/v0.0.1/ns/",
    "edc": "https://w3id.org/edc/v0.0.1/ns/",
    "odrl": "http://www.w3.org/ns/odrl/2/"
  }
}
3. Create contract [PROVIDER]
curl -d @path/to/create-contract-definition.json -H 'content-type: application/json' http://localhost:19193/management/v3/contractdefinitions -s | jq
create-contract-definition.json
{
  "@context": {
    "@vocab": "https://w3id.org/edc/v0.0.1/ns/"
  },
  "@id": "1",
  "accessPolicyId": "myPolicy",
  "contractPolicyId": "myPolicy",
  "assetsSelector": []
}
The contract above does not specify any assets to which the policy is connected. By default, it is all assets.
Example response
{
  "@type": "IdResponse",
  "@id": "myPolicy",
  "createdAt": 1727429399794,
  "@context": {
    "@vocab": "https://w3id.org/edc/v0.0.1/ns/",
    "edc": "https://w3id.org/edc/v0.0.1/ns/",
    "odrl": "http://www.w3.org/ns/odrl/2/"
  }
}
4. Fetch catalog [CONSUMER]
curl -X POST "http://localhost:29193/management/v3/catalog/request" -H 'Content-Type: application/json' -d @path/to/fetch-catalog.json -s | jq
Example response
{
  "@id": "773be931-40ff-410c-b6cb-346e3f6eaa6f",
  "@type": "dcat:Catalog",
  "dcat:dataset": {
    "@id": "myAsset",
    "@type": "dcat:Dataset",
    "odrl:hasPolicy": {
      "@id": "MQ==:YXNzZXRJZA==:ODJjMTc3NWItYmQ4YS00M2UxLThkNzItZmFmNGUyMTA0NGUw",
      "@type": "odrl:Offer",
      "odrl:permission": [],
      "odrl:prohibition": [],
      "odrl:obligation": []
    },
    "dcat:distribution": [
      {
        "@type": "dcat:Distribution",
        "dct:format": {
          "@id": "HttpData-PULL"
        },
        "dcat:accessService": {
          "@id": "17b36140-2446-4c23-a1a6-0d22f49f3042",
          "@type": "dcat:DataService",
          "dcat:endpointDescription": "dspace:connector",
          "dcat:endpointUrl": "http://localhost:19194/protocol"
        }
      },
      {
        "@type": "dcat:Distribution",
        "dct:format": {
          "@id": "HttpData-PUSH"
        },
        "dcat:accessService": {
          "@id": "17b36140-2446-4c23-a1a6-0d22f49f3042",
          "@type": "dcat:DataService",
          "dcat:endpointDescription": "dspace:connector",
          "dcat:endpointUrl": "http://localhost:19194/protocol"
        }
      }
    ],
    "name": "product description",
    "id": "myAsset",
    "contenttype": "application/json"
  },
  "dcat:distribution": [],
  "dcat:service": {
    "@id": "17b36140-2446-4c23-a1a6-0d22f49f3042",
    "@type": "dcat:DataService",
    "dcat:endpointDescription": "dspace:connector",
    "dcat:endpointUrl": "http://localhost:19194/protocol"
  },
  "dspace:participantId": "provider",
  "@context": {
    "@vocab": "https://w3id.org/edc/v0.0.1/ns/",
    "edc": "https://w3id.org/edc/v0.0.1/ns/",
    "dcat": "http://www.w3.org/ns/dcat#",
    "dct": "http://purl.org/dc/terms/",
    "odrl": "http://www.w3.org/ns/odrl/2/",
    "dspace": "https://w3id.org/dspace/v0.8/"
  }
}
The consumer finds available assets in the catalog response. In the example above, the relevant identifier for the next steps of the data exchange is the offer id at the JSON path: ./"dcat:dataset"."odrl:hasPolicy"."@id" (here: MQ==:YXNz...NGUw).
5. Negotiate contract [CONSUMER]
curl -d @path/to/negotiate-contract.json -X POST -H 'content-type: application/json' http://localhost:29193/management/v3/contractnegotiations -s | jq
negotiate-contract.json
{
  "@context": {
    "@vocab": "https://w3id.org/edc/v0.0.1/ns/"
  },
  "@type": "ContractRequest",
  "counterPartyAddress": "http://localhost:19194/protocol",
  "protocol": "dataspace-protocol-http",
  "policy": {
    "@context": "http://www.w3.org/ns/odrl.jsonld",
    "@id": "MQ==:YXNzZXRJZA==:ODJjMTc3NWItYmQ4YS00M2UxLThkNzItZmFmNGUyMTA0NGUw",
    "@type": "Offer",
    "assigner": "provider",
    "target": "myAsset"
  }
}
The request for negotiating a contract about the upcoming data exchange contains the offer id from the previous catalog response.
Example response
{
  "@type": "IdResponse",
  "@id": "96e58145-b39f-422d-b3f4-e9581c841678",
  "createdAt": 1727429786939,
  "@context": {
    "@vocab": "https://w3id.org/edc/v0.0.1/ns/",
    "edc": "https://w3id.org/edc/v0.0.1/ns/",
    "odrl": "http://www.w3.org/ns/odrl/2/"
  }
}
6. Get contract agreement ID [CONSUMER]
curl -X GET "http://localhost:29193/management/v3/contractnegotiations/96e58145-b39f-422d-b3f4-e9581c841678" --header 'Content-Type: application/json' -s | jq
The negotiation of a contract happens asynchronously. At the end of the negotiation process, the consumer can get the agreement ID by calling the contractnegotiations API with the negotiation ID from the previous response (here: 96e58145-b39f-422d-b3f4-e9581c841678).
Example response
{
  "@type": "ContractNegotiation",
  "@id": "96e58145-b39f-422d-b3f4-e9581c841678",
  "type": "CONSUMER",
  "protocol": "dataspace-protocol-http",
  "state": "FINALIZED",
  "counterPartyId": "provider",
  "counterPartyAddress": "http://localhost:19194/protocol",
  "callbackAddresses": [],
  "createdAt": 1727429786939,
  "contractAgreementId": "441353d9-9e86-4011-9828-63b2552d1bdd",
  "@context": {
    "@vocab": "https://w3id.org/edc/v0.0.1/ns/",
    "edc": "https://w3id.org/edc/v0.0.1/ns/",
    "odrl": "http://www.w3.org/ns/odrl/2/"
  }
}
7. Start data transfer [CONSUMER]
curl -X POST "http://localhost:29193/management/v3/transferprocesses" -H "Content-Type: application/json" -d @path/to/start-transfer.json -s | jq
start-transfer.json
{
  "@context": {
    "@vocab": "https://w3id.org/edc/v0.0.1/ns/"
  },
  "@type": "TransferRequestDto",
  "connectorId": "provider",
  "counterPartyAddress": "http://localhost:19194/protocol",
  "contractId": "441353d9-9e86-4011-9828-63b2552d1bdd",
  "assetId": "myAsset",
  "protocol": "dataspace-protocol-http",
  "transferType": "HttpData-PULL"
}
The consumer initiates the data transfer process with a POST message containing the agreement ID from the previous response (here: 441353d9-9e86-4011-9828-63b2552d1bdd), the asset identifier of the wanted data asset, and the transfer type.
Example response
{
  "@type": "IdResponse",
  "@id": "84eb10cc-1192-408c-a378-9ef407c156a0",
  "createdAt": 1727430075515,
  "@context": {
    "@vocab": "https://w3id.org/edc/v0.0.1/ns/",
    "edc": "https://w3id.org/edc/v0.0.1/ns/",
    "odrl": "http://www.w3.org/ns/odrl/2/"
  }
}
8. Get the data [CONSUMER]
8.1. Get the data address [CONSUMER]
curl http://localhost:29193/management/v3/edrs/84eb10cc-1192-408c-a378-9ef407c156a0/dataaddress | jq
The result of starting a transfer process is a DataAddress that the consumer can get by calling the endpoint data reference API (edrs) with the identifier of the started transfer process (here: 84eb10cc-1192-408c-a378-9ef407c156a0).
Example response
{
  "@type": "DataAddress",
  "type": "https://w3id.org/idsa/v4.1/HTTP",
  "endpoint": "http://localhost:19291/public",
  "authType": "bearer",
  "endpointType": "https://w3id.org/idsa/v4.1/HTTP",
  "authorization": "eyJraWQiOiJwdW...7Slukn1OMJw",
  "@context": {
    "@vocab": "https://w3id.org/edc/v0.0.1/ns/",
    "edc": "https://w3id.org/edc/v0.0.1/ns/",
    "odrl": "http://www.w3.org/ns/odrl/2/"
  }
}
8.2. Get the data content [CONSUMER]
curl --location --request GET 'http://localhost:19291/public/' --header 'Authorization: eyJraWQiOiJwdWJsaW...7Slukn1OMJw'
The consumer can fetch the data about the wanted data asset by calling the endpoint that is included in the previous data address response (here: http://localhost:19291/public). The previous response also includes the required access token (here: eyJraWQiOiJwdWJsaW...7Slukn1OMJw shortened).
The response of this request is the actual data content from the data source.
The consumer calls the public API endpoint that was shared by the provider. The request is authorized with the token that was shared as well. The provider now fetches the data from the data source based on the configuration of the data asset from the first step, and forwards the response to the consumer.
Example script
The Python script connector.py executes the data exchange process as described above step by step.
It makes use of the JSON files in the folder ./assets/connector/.
ACCURIDS Demonstrator
The demonstrator makes use of the ACCURIDS FAIR data registry.
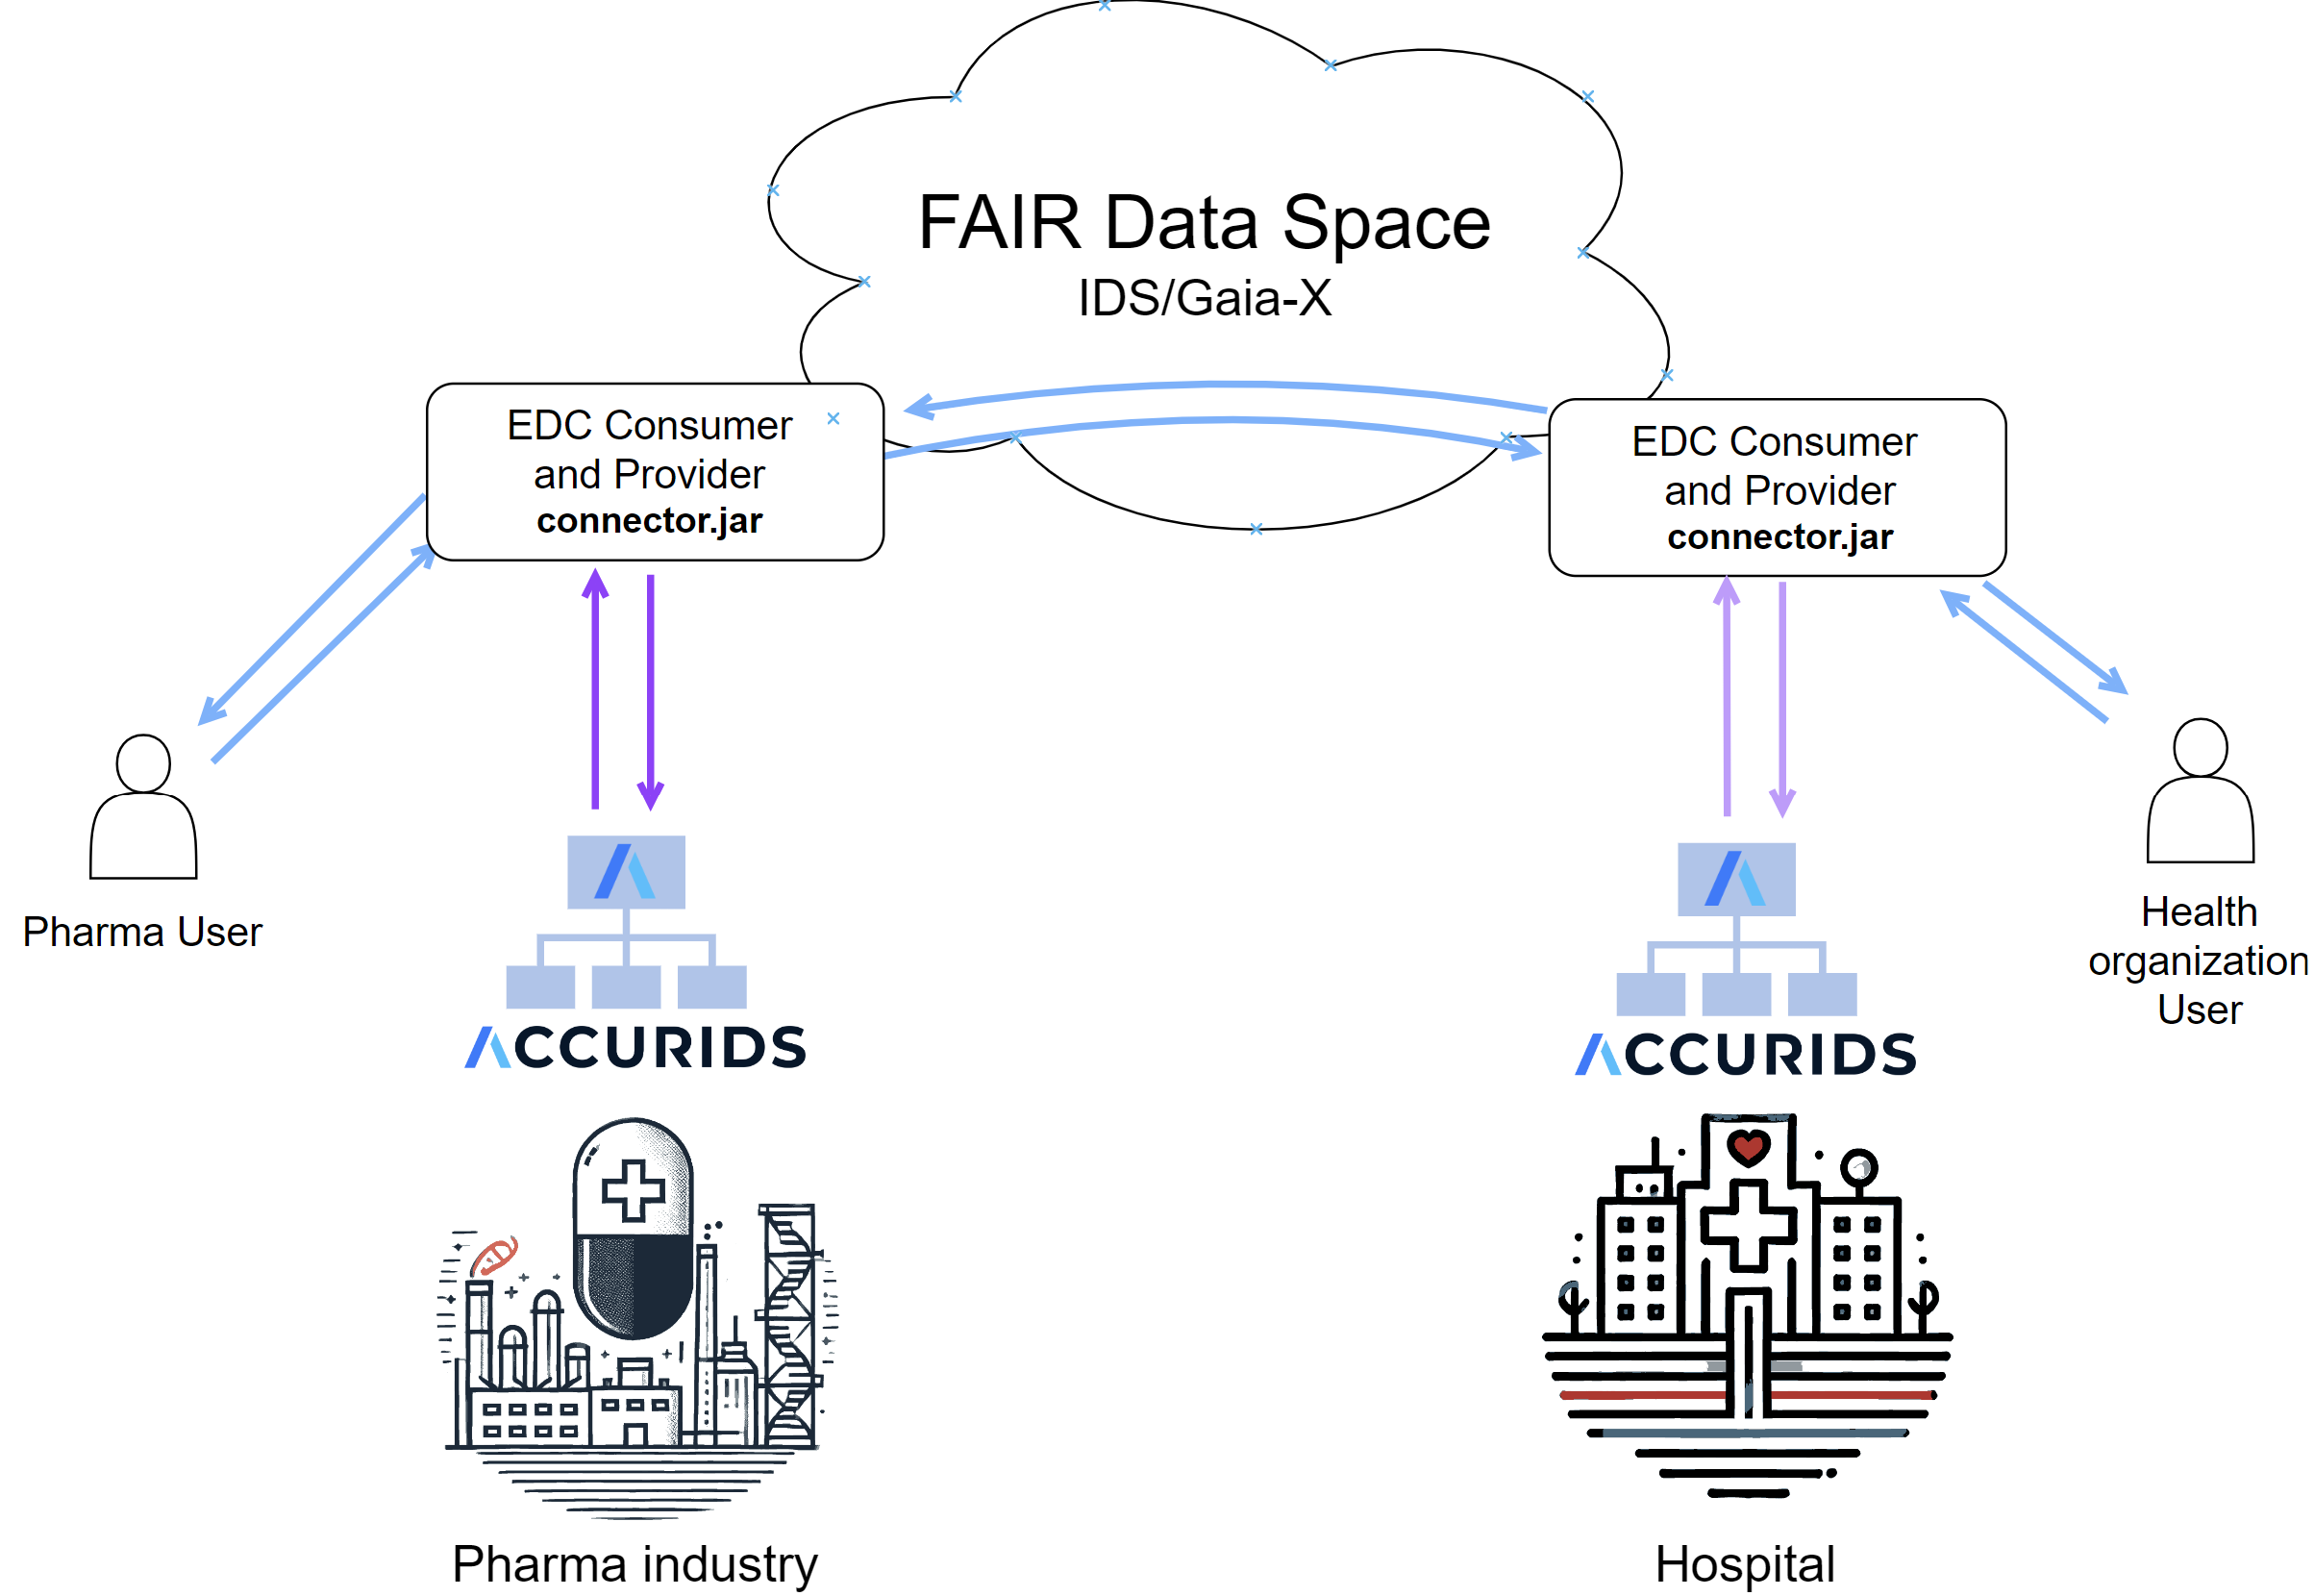
We demonstrate data exchange between industry and an organization.
For example, exchange of information related to clinical studies between a hospital and a pharmaceutical company.
The diagram below represents the use case of the demonstrator with two ACCURIDS instances, both acting as consumers and providers of information.
The ACCURIDS platform
ACCURIDS is a platform for centralized data governance with a FAIR data registry.
It enables users to uniquely identify their data objects across systems and processes at enterprise and industry scale.
ACCURIDS offers six core features:
Ontology
- Reusing standard industry ontologies through ACCURIDS Hub
- Creation of specific ontologies for business needs
Reference and Master Data
- Managing reference and master data aligned to ontology definitions
Data Registry
- Governance of data objects managed in many different systems through a centralized registration process
- Management of data object identities
Graph
- Connect data from different sources in knowledge graphs to enable question answering and analytics
Quality
- Define and monitor data quality rules for different types of data objects
AI
- Ask business questions in natural language and get answers based on facts from the knowledge graph
ExpandAI demonstrator
Demonstrator overview
The goal of this demonstrator is a secure and legally compliant method to collect and manage data from various wearable sensor sources (e.g. smartphone and smartwatch), which can then be used to train AI algorithms. The prototype focuses on integrating AI-based DiGAs into the healthcare ecosystem by adhering to the FAIR (Findability, Accessibility, Interoperability, and Reusability) and Gaia-X principles. These guidelines ensure that data management is transparent, accessible, and fair. The ability to gather and analyze data about health conditions and influencing factors is crucial for developing new therapies and holistic care strategies.
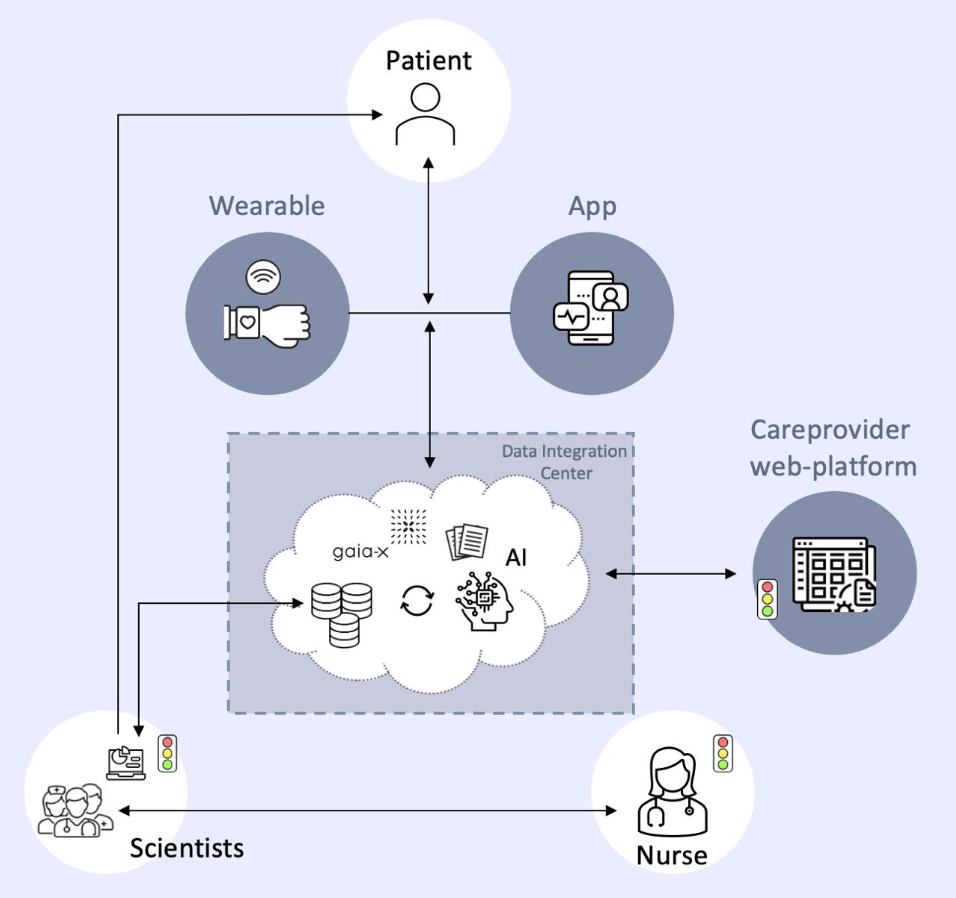
At the core of this project is a data integration center, which gathers and standardizes Parkinson patient data from a smartphone (iPhone 12 Pro Max) and smartwatch (Apple Watch Series 8). AI analytics within the center enable near real-time data insights, supporting Parkinson healthcare professionals and researchers in decision-making and advancing medical research. Our prototype proposes a framework for secure data exchange between scientific institutions and industry partners. This collaboration can empower healthcare providers to monitor Parkinson patient health using a simple traffic light system to indicate their condition: green for well, yellow for unwell but not critical, and red for emergencies. This system will be accessible via a web platform for doctors, providing valuable insights while minimizing data sharing. Moreover, limited access to these databases for companies developing DiGAs could enhance AI model training and product development, ultimately advancing personalized healthcare and improving patient outcomes.
Dashboard
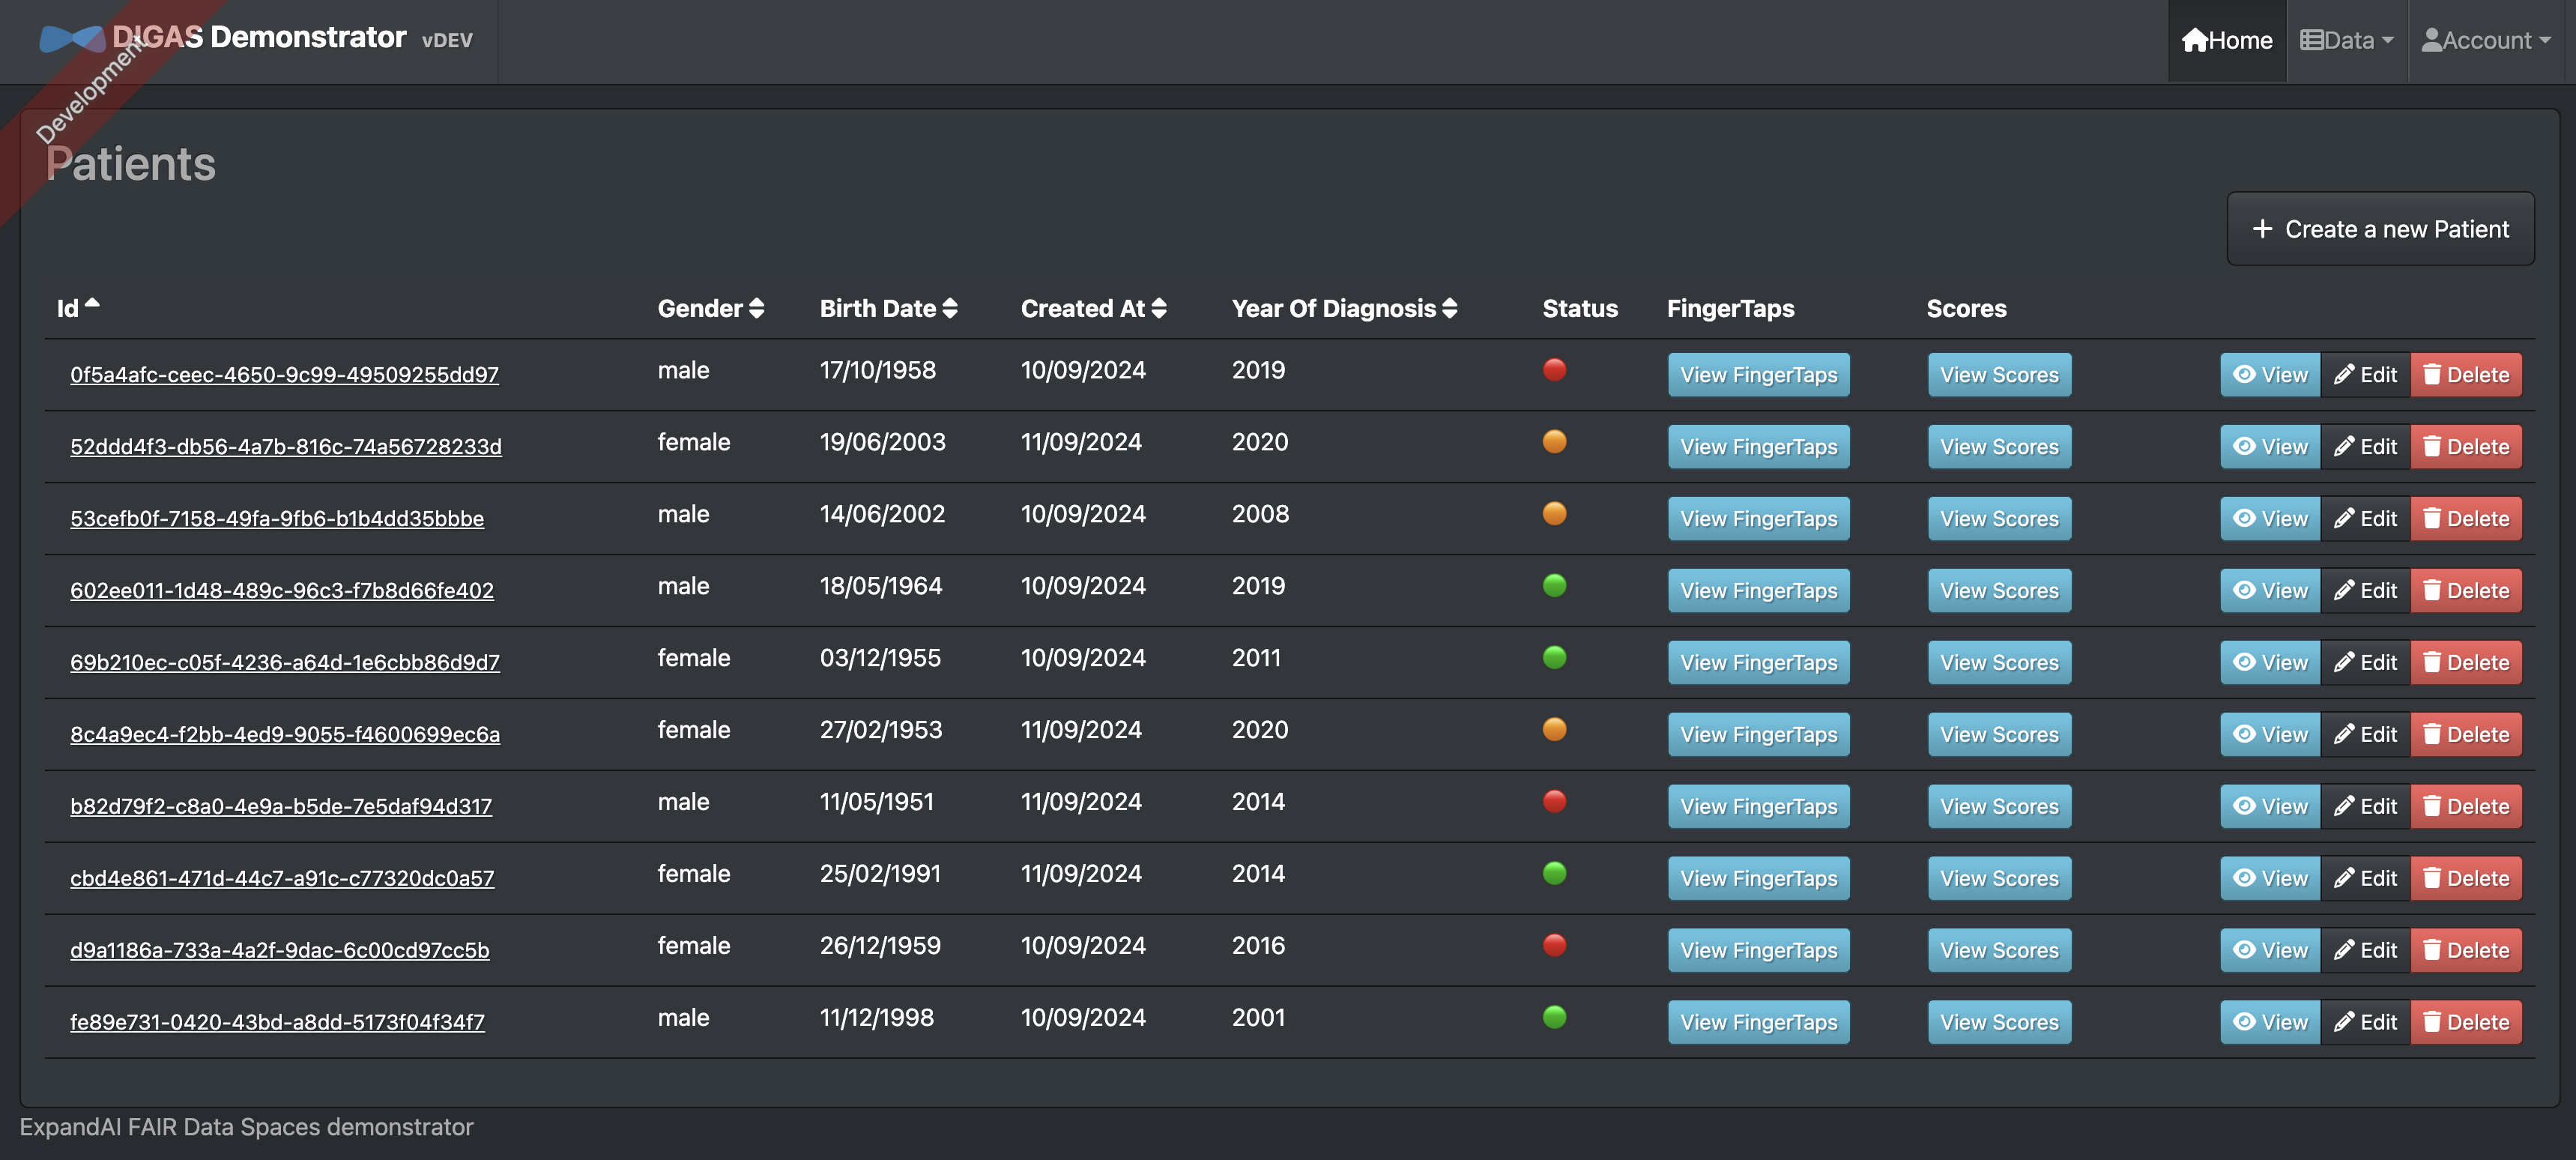
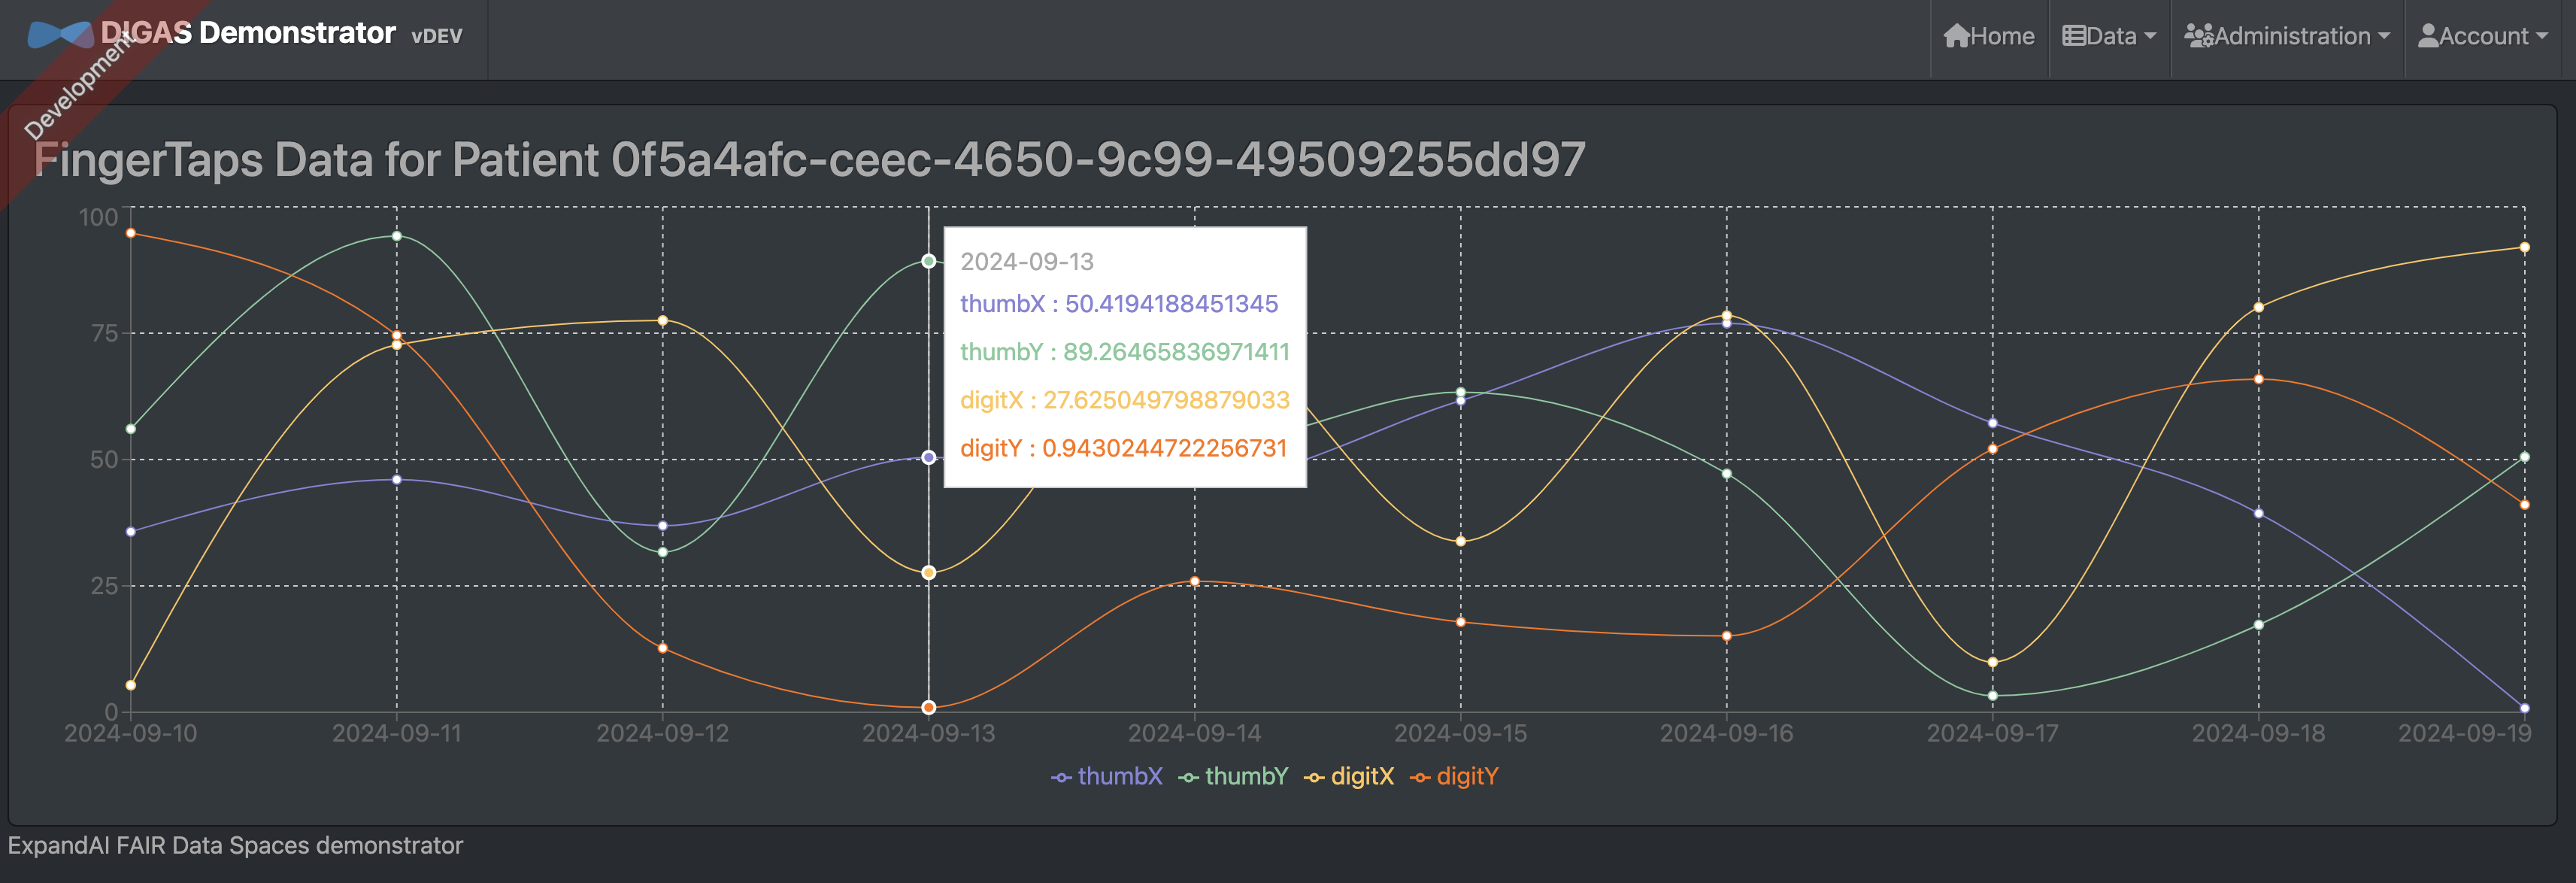
The dashboard provides a clear, organized interface for displaying both results and finger-tap data, offering insights into patient motor performance. The use of visual elements like charts and traffic lights effectively communicates the data trends and potential areas of concern. The chart highlights key metrics, thumb and digit movements over time, allowing users to track progress or deterioration. The traffic light system adds a simple yet powerful tool for quick assessments, signaling performance status with an intuitive red-yellow-green scheme.
Technologies used
The FAIR data space enables information exchange between research and industry organizations.
- Java
- Spring Boot
- React
- Gaia-x standards
- Docker Containers
- Github
- REST and OpenAPI
Geo Engine Demonstrator
The Geo Engine FAIR-DS demonstrator realizes multiple use cases that show the capabilities of the NFDI data spaces and address important societal issues like the loss of biodiversity and climate change. Within the FAIR-DS project, the Geo Engine software is extended with FAIR data services and capabilities for data spaces. New dashboards and visualizations are developed to demonstrate added value from the FAIR-DS integration.
Overview of the Geo Engine Platform
Geo Engine is a cloud-ready geo-spatial data processing platform.
It consists of the backend and several frontends.
The backend is subdivided into three subcomponents: services, operators, and data types.
Data types specify primitives like feature collections for vector or gridded raster data.
The Operators block contains the processing engine and operators.
The Services block contains data management and APIs.
It also contains external data connectors, that allow accessing data from external sources.
Here, the connection to the data spaces is established.
Frontends for the Geo Engine are geoengine-ui for building web applications on top of Geo Engine.
geoengine-python offers a Python library that can be used in Jupyter Notebooks.
3rd party applications like QGIS can access Geo Engine via its OGC interfaces.
All components of Geo Engine are fully containerized and Docker-ready. A GAIA-X-compatible self-description of the service is available. Geo Engine builds upon several technologies, including GDAL, arrow, Angular, and OpenLayers.
Aruna Data Connector
The ArunaDataProvider implements the Geo Engine data provider interface.
It uses the Aruna RPC API to browse, find, and access data from the NFDI4Biodiversity data space using the Aruna data storage system.
By performing the translation between the Aruna API and the Geo Engine API, the connector allows to use data from the NFDI4Biodiversity data space in the Geo Engine platform.
This makes it possible to integrate the data easily into new analyses and dashboards.
Copernicus Data Space Ecosystem
To show cross data space capabilities and to generate insightful results, the Geo Engine demonstrator is connected to the Copernicus Data Space. It uses the SpatioTemporal Asset Catalog (STAC) API and an S3 endpoint to generate the necessary meta data to access Sentinel data. Users can then access the Sentinel data as proper data sets and time series, rather than just as individual satellite images. This enables temporal analysis and the generation of time series data products.
Machine Learning Pipeline
The Demonstrator leverages Geo Engine's machine learning pipeline. It allows streaming data from the Geo Engine to Python and train a model. The model can then be uploaded and registered in the backend and then used as an operator to predict new and unseen data.
ECOMETRICS Dashboard
The ECOMETRICS dashboard is a custom app developed for FAIR-DS. It allows the user to visualize and analyze an ecological indicator, like vegetation or land use. The demonstrator consists of two parts. The UI is the user-facing part of the application while the indicator generation happens on the backend.
UI (Dashboard)
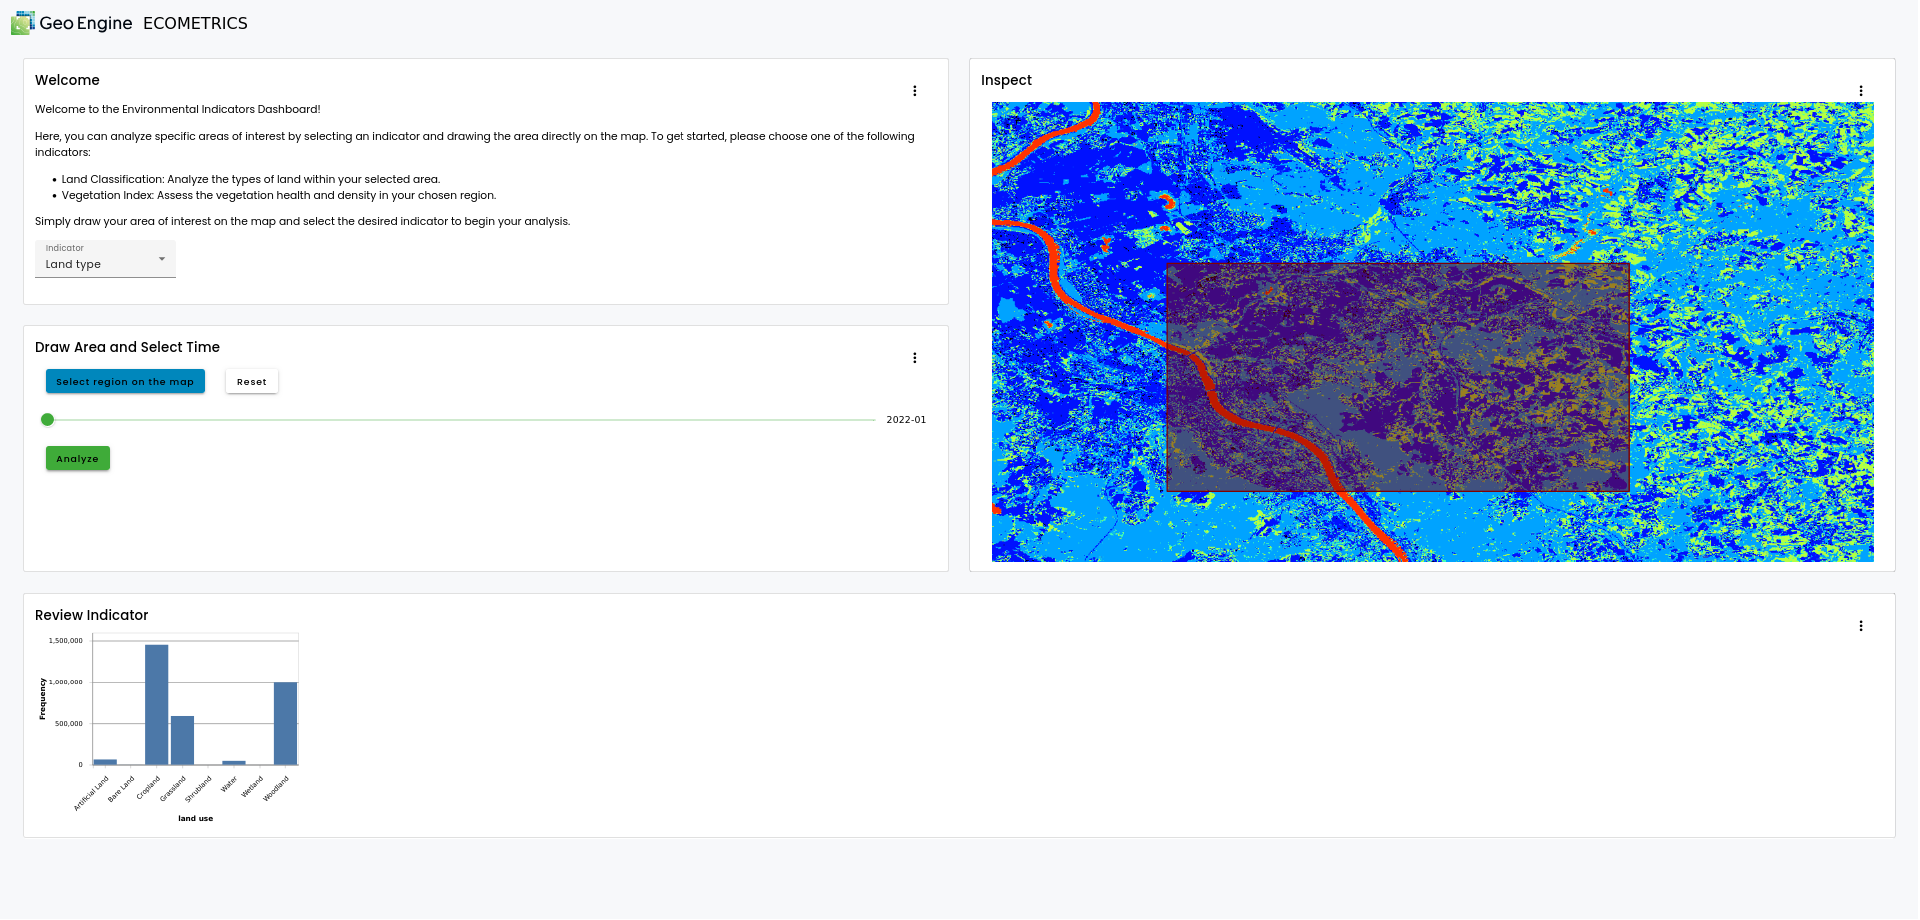
As visible in the screenshot, the ECOMETRICS app consists of four components. The top left explains how the app works and lets the user select the ecological indicator. Upon selection, the indicator will be visualized on the map on the right. The user can then select a region of interest by drawing on the map and selecting a point in time on a slider. The region will be intersected with the indicator. Finally, the user can review the results in the bottom-most section of the app on a plot. In case of a continuous indicator like vegetation, the plot will show a histogram. In case of a classification indicator like land use, the plot will show a class histogram.
Indicator generation
An indicator for the ECOMETRICS app is a raster time series that is either continuous or a classification.
Currently, there are two indicators available: NDVI and land use.
Both indicators are built from Sentinel data.
The NDVI, short for Normalized Difference Vegetation Index, is computed by aggregating all Sentinel tiles for a given year and by computing (A-B)/(A+B) where A is the near infrared channel and B is the red channel.
The necessary data is provided by Geo Engine's Copernicus Data Space Ecosystem Connector.
Machine Learning
The land use indicator is created by training a machine learning model. The training process incorporates the Sentinel data and uses the land use and land cover survey (LUCAS) as ground truth. While the Sentinel data are again retrieved from the Copernicus Data Space, the LUCAS data are used via the Aruna data connector. In principle, any data accessible using the Aruna data connector can be used for machine learning with Geo Engine.
The model is trained in a Jupyter notebook that defines a Geo Engine workflow, feeds the resulting data into a machine learning framework, trains the model, and registers it with the Geo Engine. The workflow applies feature engineering on the data and re-arranges it via timeshift operations This gives the classifier the temporal development for each training pixel at once and allows learning the different land usage types.
Value Proposition
The demonstrator shows the benefits of FAIR Data Spaces for science and industry. By linking data from different sources and applying ML methods, new insights can be gained and innovative applications developed. It showcases a system that connects data from science and industry across data spaces, applying it through machine learning while adhering to FAIR principles.
Benefits:
- For industry: The system enriches existing datasets with publicly available data and provides direct access to modern analysis frameworks using machine learning. This allows for direct data use, easy reuse of data and models, and avoids redundant calculations. A concrete example is combining observational and climate data with machine learning for biodiversity reporting, such as property classification.
- For research: The system showcases the relevance of research data through transparent provenance and workflows. This facilitates funding applications and fosters collaboration between research institutions and companies, which is increasingly required by funding agencies.
Contribution to FAIR Data Spaces
The demonstrator contributes to the advancement of FAIR Data Spaces by scaling FAIR principles to broader data ecosystems and diverse sectors. It aims to create sustainable and efficient data infrastructures that support cross-sectoral data exchange and promote interoperability and the use of data standards through use cases that provide real benefits for science and industry. yy
ESG Indicator and Virtual Data Trustees
The ESG Indicator demonstrator provides companies with concrete data to assess their environmental impact, streamlining one step of the process of creating quantitative figures in ESG reports. By leveraging research data to develop practical models, it fosters collaboration between academia and industry. The demonstrator outlines incentives for the development of new applications in the fields of artificial intelligence and geospatial data, contributing to technological advancements and sustainable solutions.
Data Trustee
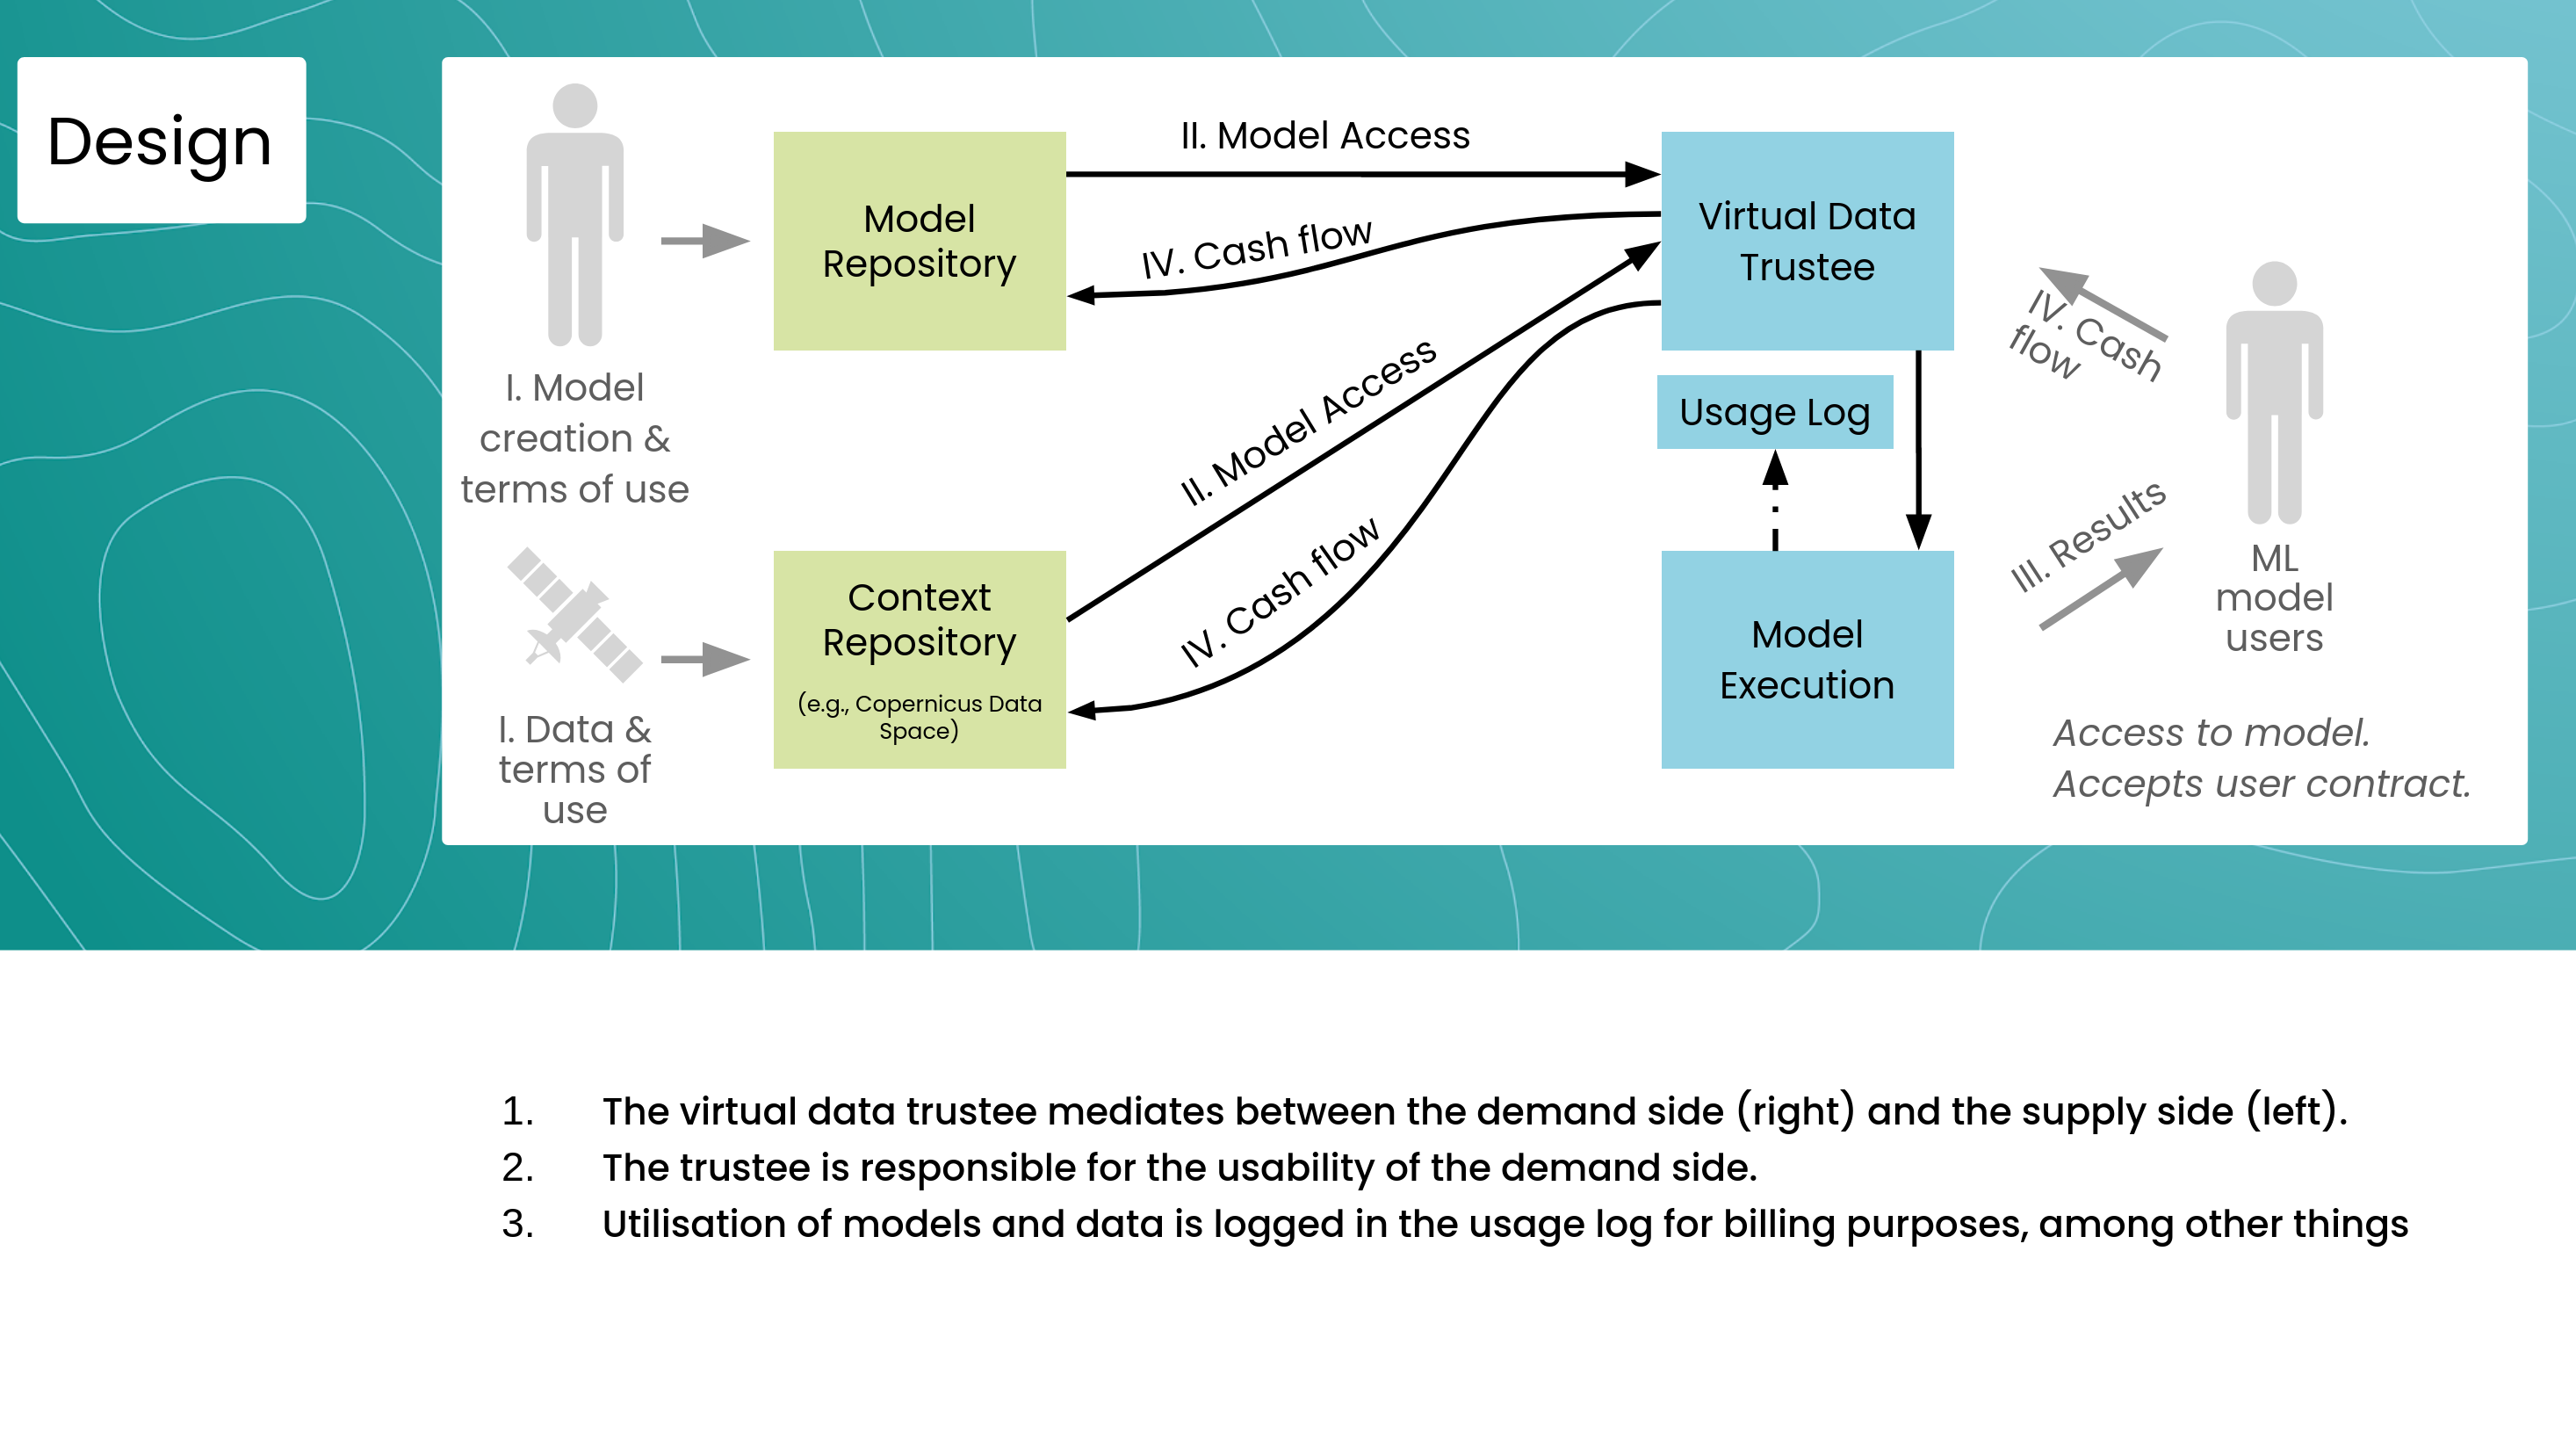
The diagram illustrates a virtual data trustee model, where the trustee acts as an intermediary between data suppliers and data consumers, in this case research institutions and industry companies. The data supplier provides models and data, while the data consumer accesses and utilizes these resources. The trustee ensures the usability of the data and models for the consumer, logs usage for billing and reproducibility, and facilitates the exchange of data and models between the three data spaces. This model promotes efficient and secure data sharing and utilization.
UI (Dashboard)
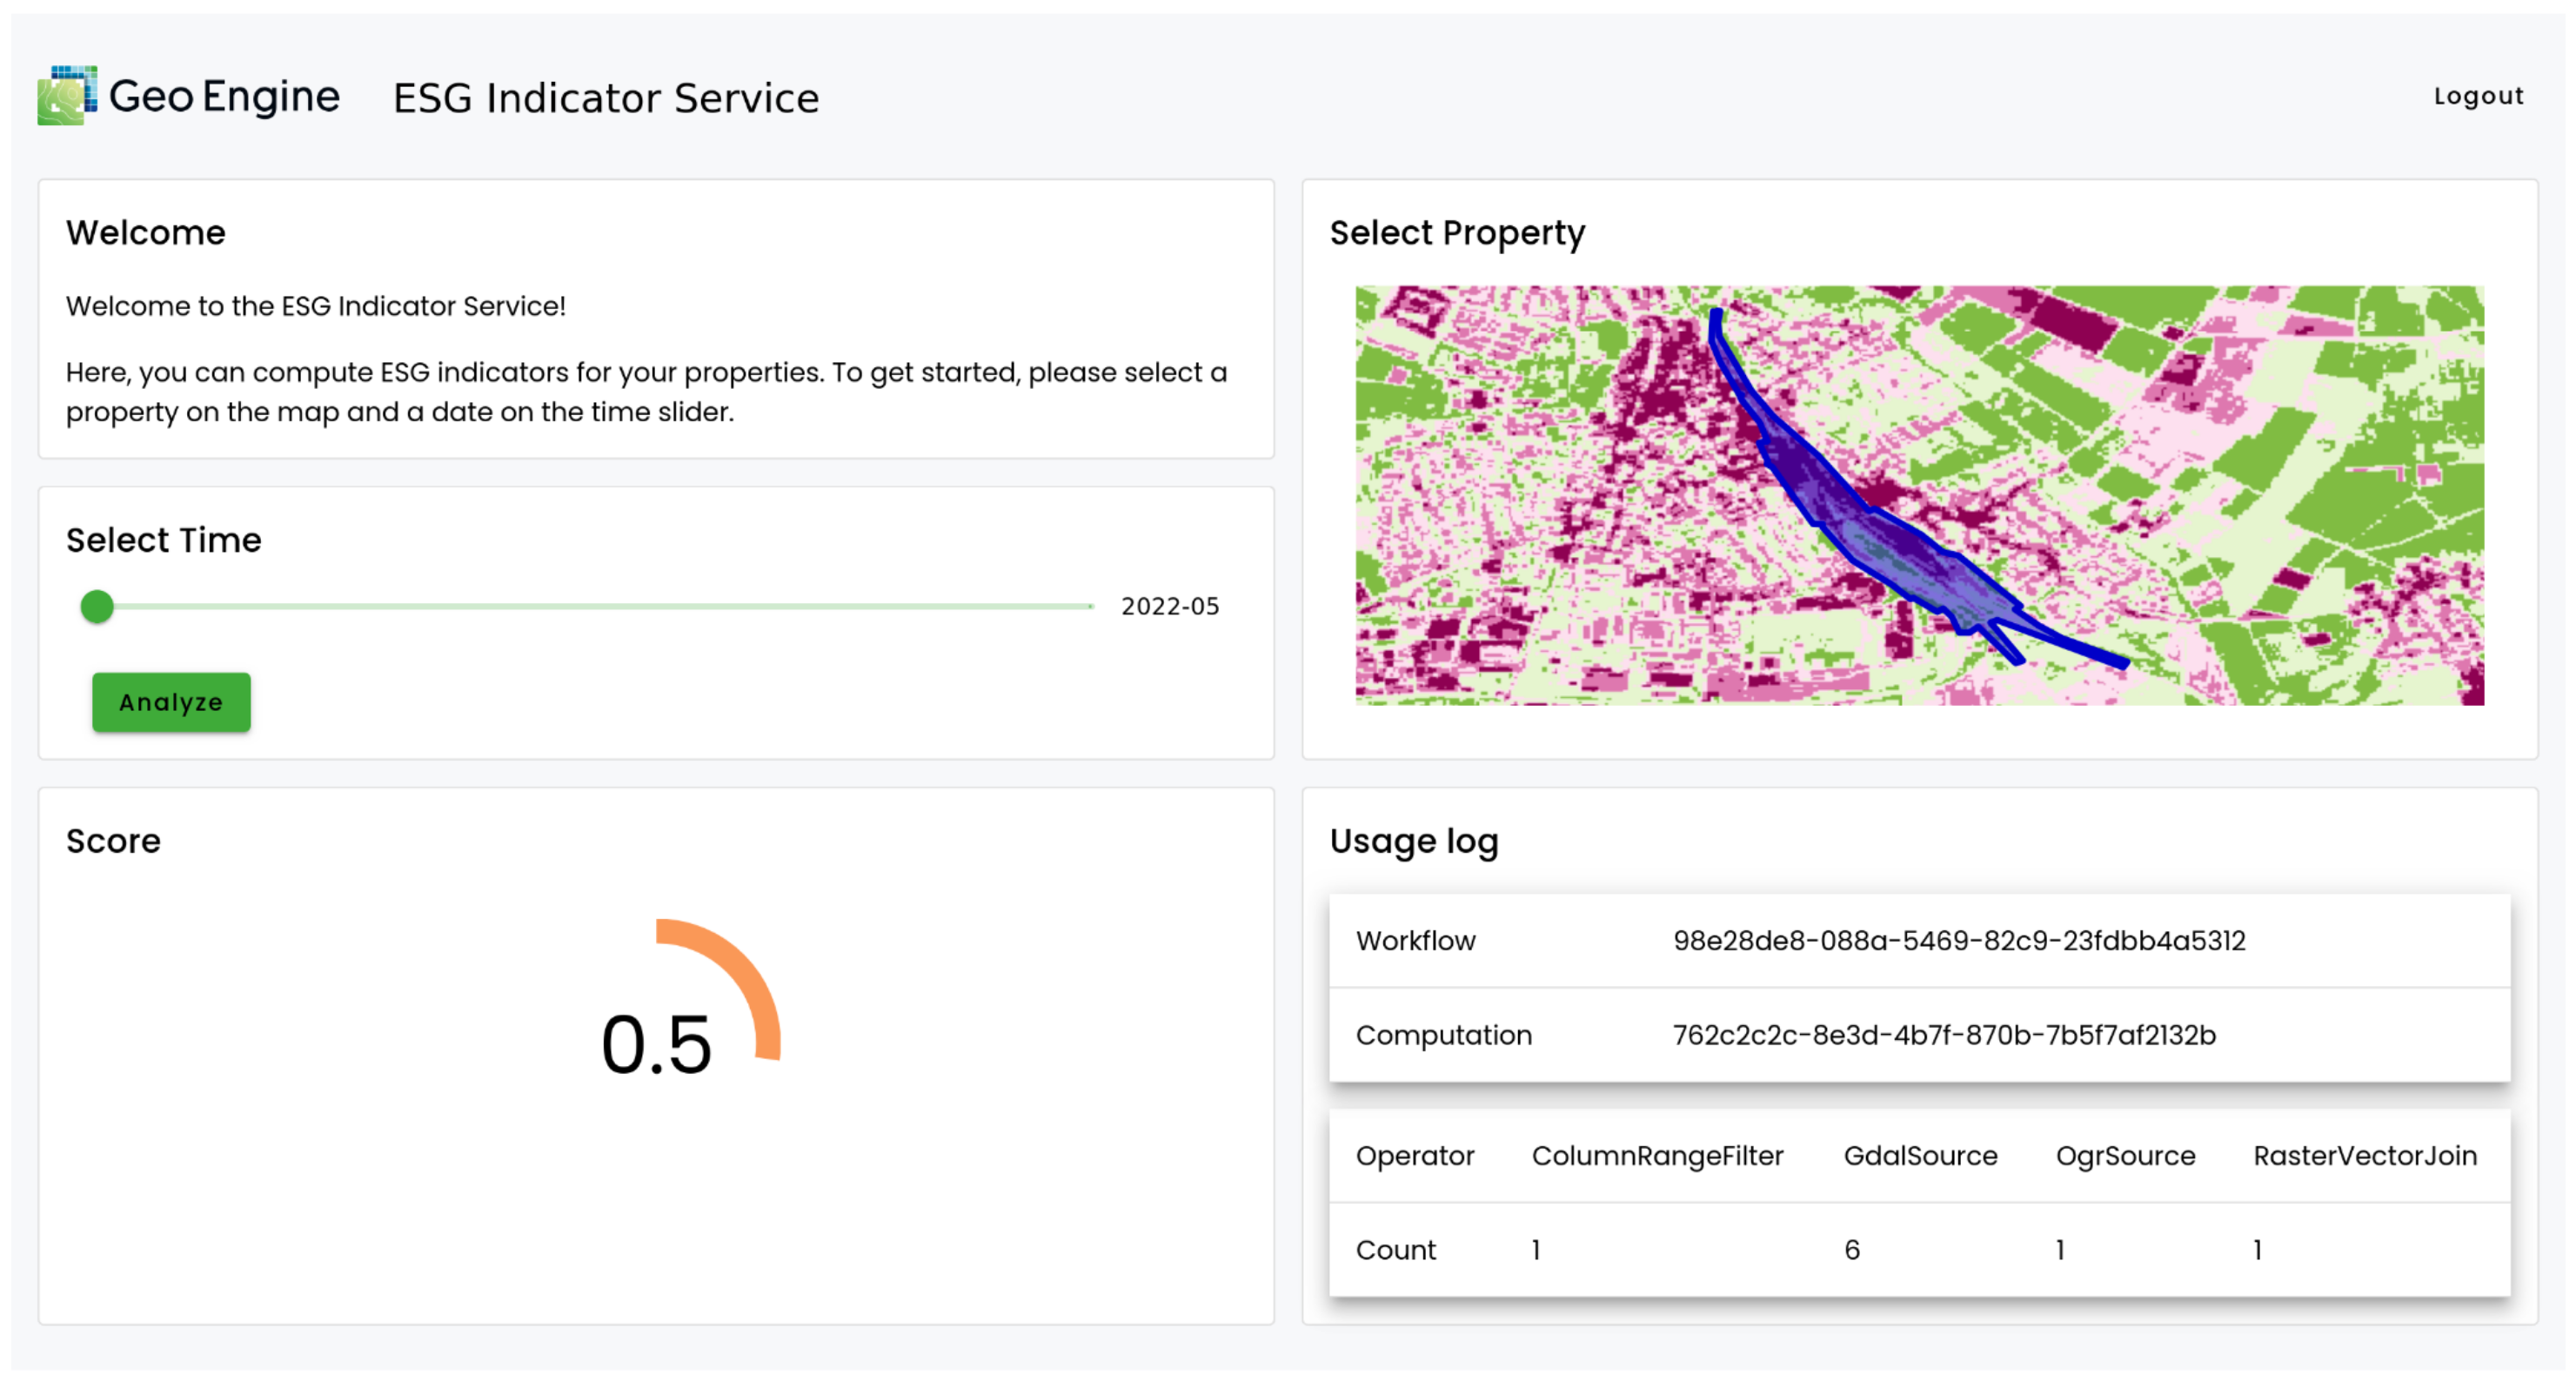
The UI provides a user-friendly interface for calculating an ESG (Environmental, Social, and Governance) indicator for specific properties. Users can select a property on a map, specify a date range using a time slider, and initiate the analysis process. The calculated ESG score is displayed visually, and detailed usage logs are available for transparency. This tool empowers users to assess the sustainability performance of properties over time.
ML-based Indicator
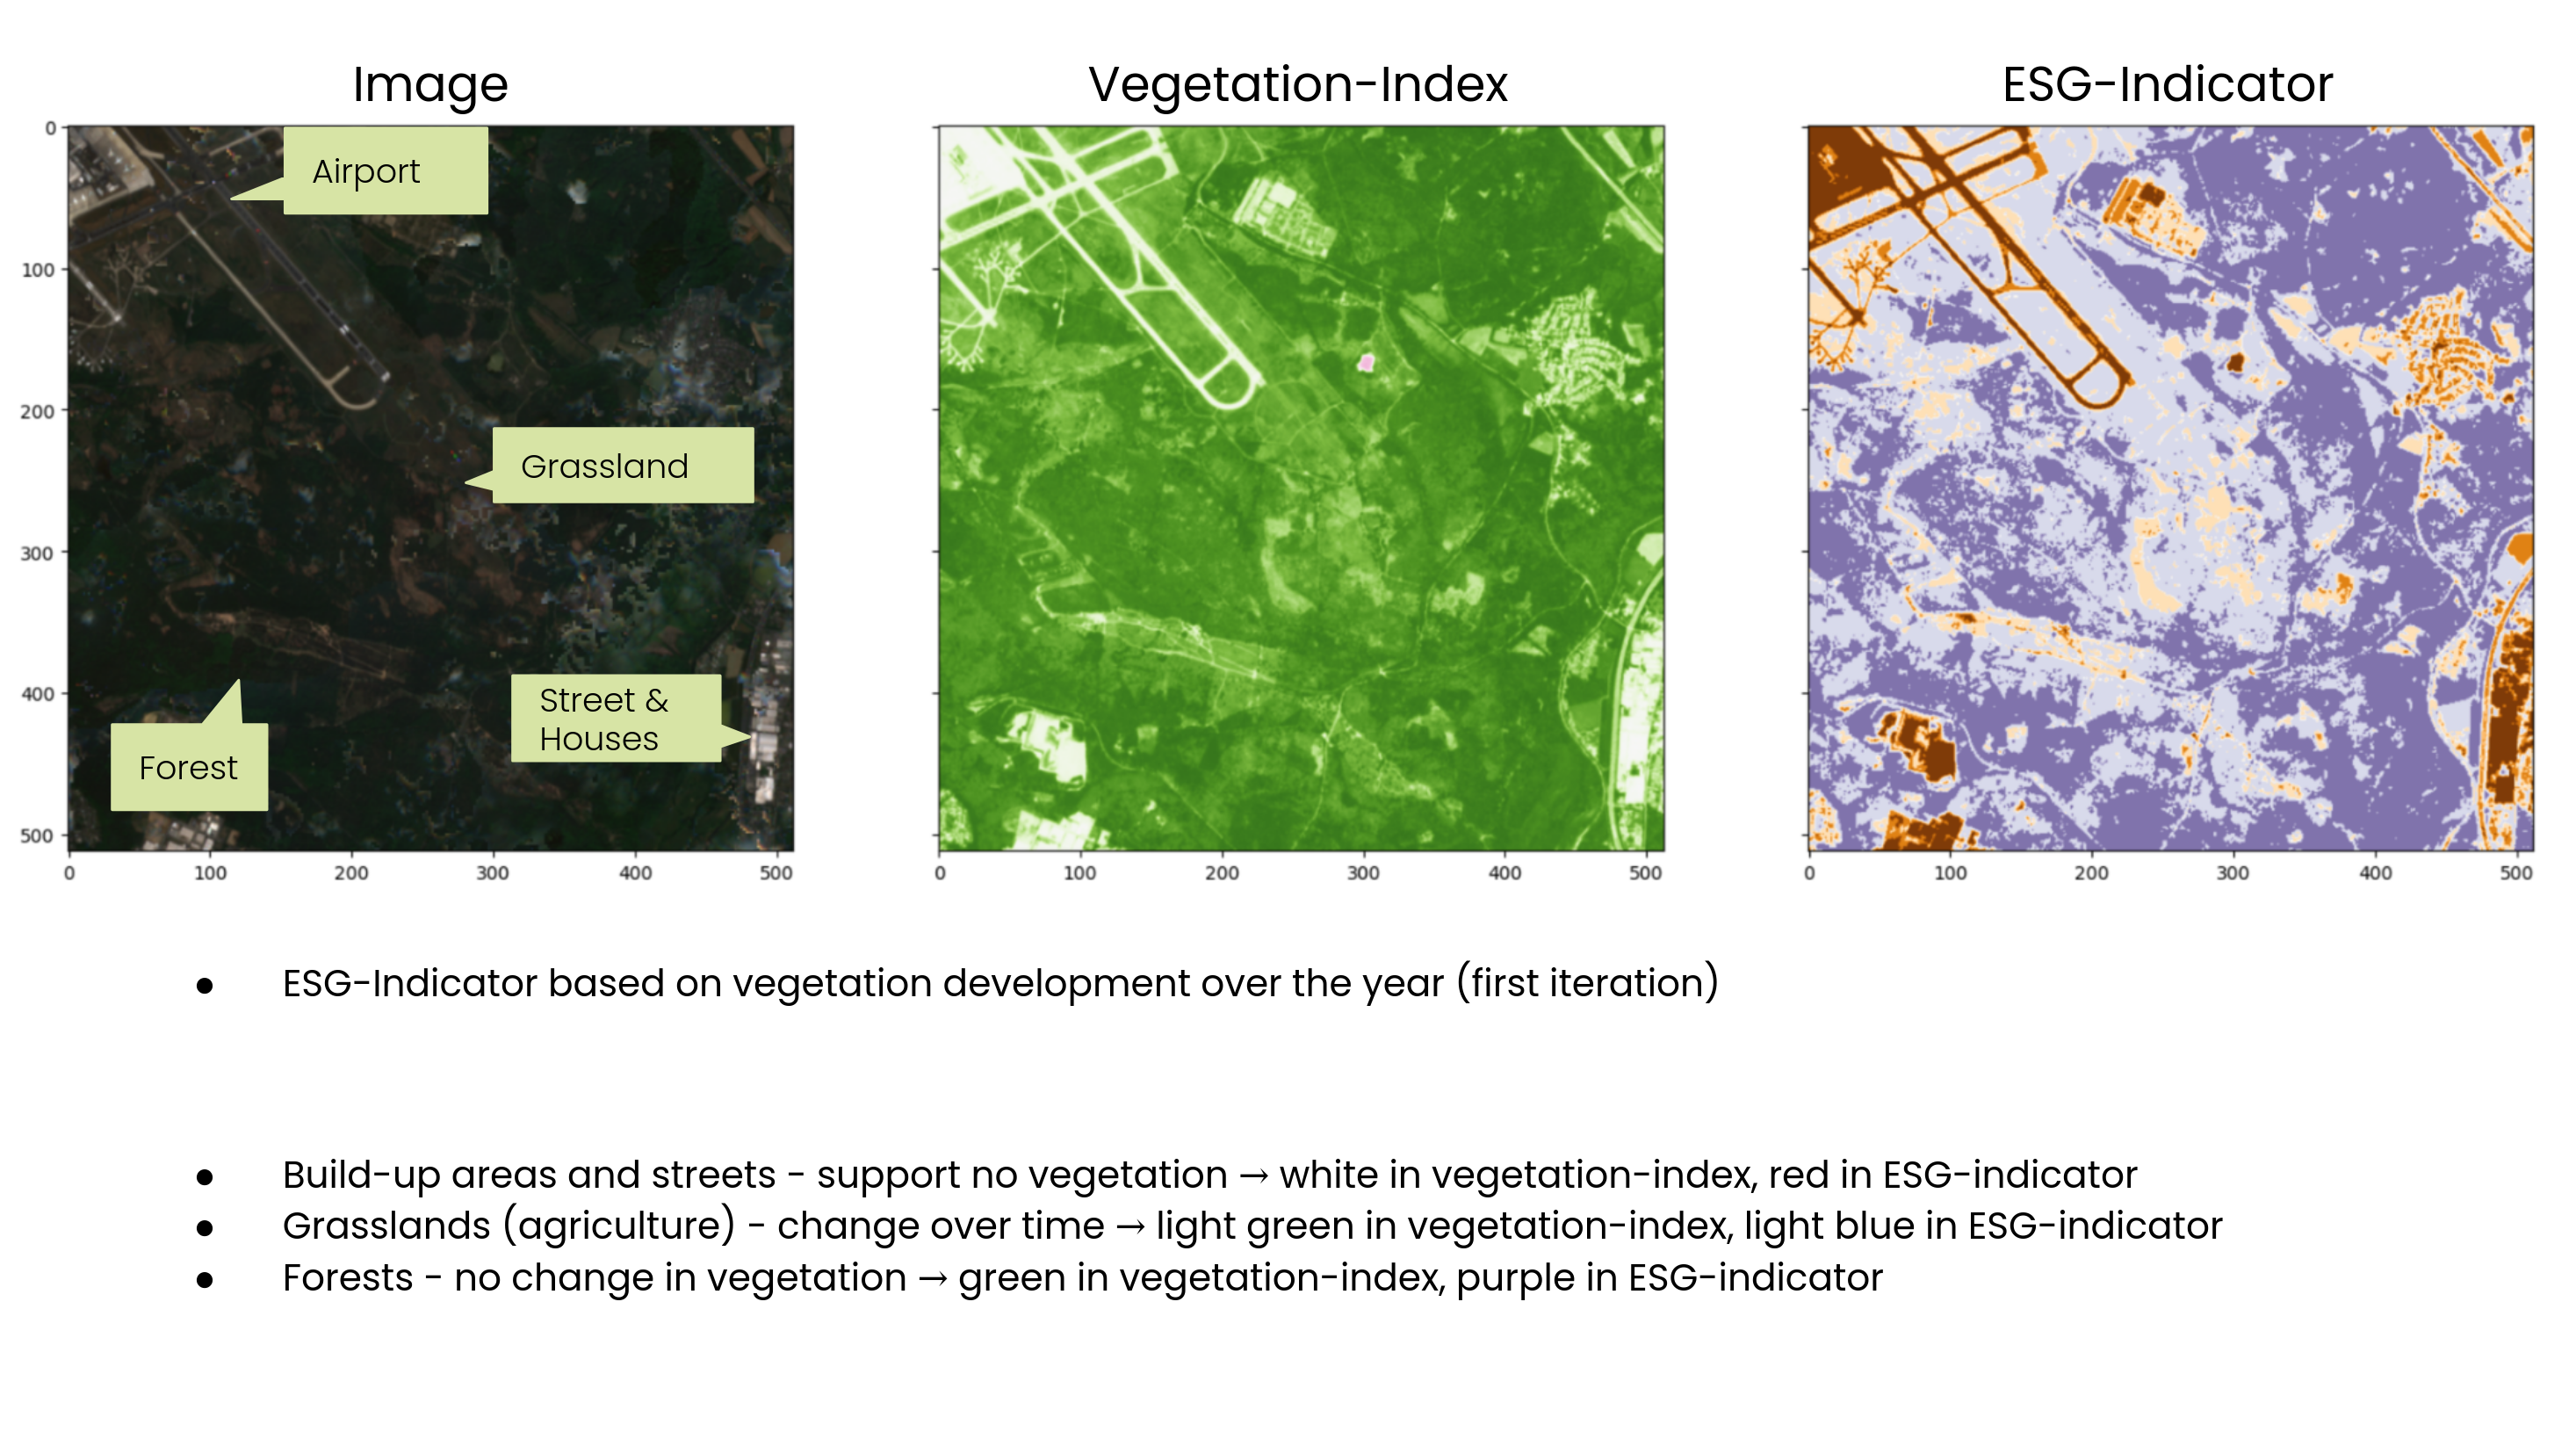
The biodiversity indicator shown in the image assesses the vegetation within a given area over time. It utilizes a vegetation index (NDVI) to track changes in vegetation cover, with different colors representing various land cover types. For example, built-up areas and streets, that support no vegetation, are depicted in white in the vegetation index and red in the ESG indicator. Grasslands, which exhibit seasonal changes, appear light green in the vegetation index and light blue in the ESG indicator. Forests, with stable vegetation cover, are represented by green in the vegetation index and purple in the ESG indicator. This indicator provides valuable insights into the biodiversity and ecological health of a region, contributing to quantitative ESG reporting.
Value Proposition
This demonstrator establishes a virtual data trustee that connects data from industry (with DB as a pilot user), the space sector (Copernicus Data Space Ecosystem), and science (NFDI4Biodiversity-RDC). This data trustee acts as a secure intermediary, facilitating access to data from these different domains while upholding FAIR-DS principles.
Benefits
- Enhanced Collaboration: The demonstrator has the potential to foster collaboration between industry and research in the field of biodiversity analysis. By connecting industrial data spaces to research data infrastructure, companies like Deutsche Bahn can benefit from the data and analytical methods available, while research institutions can improve their models and gain new insights through access to industrial data.
- Mutual Gains for Research and Industry: Access to a broader range of data leads to improved analyses and models. Both sides can define data access and control the use of their own data. Practical Applications: The data trustee enables the creation of operational services, such as ESG reporting metrics, which can be used by industry. For research, it increases visibility and funding opportunities.
Addressing data confidentiality, particularly for sensitive information like location data, is a key concern. The data trustee allows derived data and products to be shared without revealing the original data. Provenance tracking ensures transparency and proper attribution of data sources.
By using a virtual data trustee, the demonstrator aims to enhance FAIR-DS principles, incentivize the use of data spaces, and address the needs of various stakeholders. It anticipates that the demonstrator can serve as a foundation for developing further applications in ESG reporting and biodiversity analysis, with the data trustee concept enabling the secure and trustworthy processing of sensitive data.
RuQaD Architecture
This document describes the architecture of the RuQaD Demonstrator
The RuQaD Demonstrator is the main product of the project "RuQaD Batteries - Reuse Quality-assured Data for Batteries". The project is a sub-project of the FAIR Data Spaces project, supported by the German Federal Ministry of Education and Research under the Förderkennzeichen FAIRDS09
- Introduction and Goals
- Context and Scope
- Building Block View
- Runtime View
- Deployment View
- Cross-cutting Concepts
- Risks and Technical Debts
- Glossary
- License
Introduction and Goals
Requirements Overview
The aim of the project is to build a demonstrator that connects a research data infrastructure (PoLis) with an industrial data space (BatCAT) to reuse datasets for new applications.
Technically, this is to be realized as a tool (RuQaD) that exports data from the source system, the research data management system Kadi4Mat. RuQaD carries out quality and meta data checks (involving an existing pipeline) and pushes the data into the target system, the research data management system LinkAhead, that is the basis of the BatCAT data space.
The motivation is to allow a seamless exchange of data between research and industry. It is important to ensure that the FAIR criteria are met, therefore a dedicated check for meta data and the FAIR criteria is implemented. The FAIR criteria can be summarized to the following practical checks:
- Is a PID present?
- Is the domain-specific meta data complete?
- Is there provenance information?
- Does the data include license information?
The normative description of all requirements is contained in the non-public project proposal.
Quality Goals
RuQaD's main quality goals are, using the terms from ISO 25010 (see glossary for definitions):
- Operability: As a demonstrator, the main quality goal of the software is to be understood and learned. This facilitates building prototypes or production software based on the functionality of the demonstrator.
- Compatibility: The system connects different software systems and therefore acts as a compatibility component.
- Transferability: In order to serve as a tool for demonstration in different environments, the system needs to be built at a high level of transferability.
- Maintainability: The project's limited time frame also scopes the maintainability goal: As a demonstrator, some parts of the system can be considered work-in-progress and need to be modified, corrected or adapted over time.Whenever code is being contributed to components which have already a forseeable future in other contexts the maintainability must be taken in consideration. On the other hands, code which mainly serves the demonstration of the particular scenario (PoLiS/BatCAT) it is acceptable to provide only PoC implementations which need adjustments for a long-term maintenance.
Stakeholders
| Role/Name | Expectations |
|---|---|
| IndiScale | Quality and FAIRness of entities are successfully annotated. |
| PoLis / Kadi4Mat | Entities can be exported to other dataspaces. |
| BatCAT Dataspace | Receive valuable dataset offers. |
| FAIR DS Project | Showcase the concept of FAIR Data Spaces with a relevant, plausible and convincing use case. |
System Landscape
Rationale
The RuQaD demonstrator uses service integration to achieve the goal of connecting dataspaces in a FAIR manner. It configures and combines existing services to multiple stages of FAIRness evalution and data integration.
Contained Building Blocks
- Monitor: Checks for new data in a Kadi4Mat instance.
- Quality checker: Passes new data to the quality checker which was developed in WP 4.2 of the previous Fair DS project.
- RuQaD crawler: Calls the LinkAhead crawler for metadata checking and for insertion into the BatCAT data space node.
Monitor
Purpose / Responsibility
The monitor continuously polls a Kadi4Mat instance (representing the source dataspace) for new data items.
Interface(s)
Each new data item is passed on to the quality checker for evaluation of the data quality. Afterwards the monitor passes the quality check report and the original data to the crawler, which eventually leads to insertion in the BatCAT data space where the items can be checked by data curators and retrieved by data consumers.
Directory/File Location
Source code: src/ruqad/monitor.py
Quality Checker
Purpose / Responsibility
The quality checker executes data quality checks on the data which was retrieved from the input dataspace (a Kadi4Mat instance in this case). It provides a structured summary for other components and also a detailed report for human consumption.
Interface(s)
The quality checker is implemented as a Python class QualityChecker which provides mainly a check(filename, target_dir) method to check individual files. This class is available in the module ruqad.qualitycheck.
Quality / Performance Characteristics
The quality checker relies on the demonstrator 4.2 to perform the checks. Thus, RuQaD relies on further maintenance by the demonstrator's development team.
Directory/File Location
Source code: src/ruqad/qualitycheck.py
Open issues
- The demonstrator 4.2 service currently relies on running as Gitlab pipeline jobs, which introduces a certain administrative overhead for production deployment.
- It is possible and may be desirable to parallelize the quality check for multiple files by distributing the load on a number of service workers, instead of checking files sequentially.
RuQaD Crawler
Purpose/Responsibility
The RuQaD Crawler executes metadata checks and bundles data and metadata for insertion into the BatCAT dataspace.
Interface(s)
The crawler is implemented as a Python module with a function trigger_crawler(...) which looks for data and quality check files to evaluate and insert into the BatCAT dataspace. It uses LinkAhead's crawler framework for metadata checks, object creation and interaction with the target dataspace.
Directory / File Location
Source code: src/ruqad/crawler.py
Level 2
White Box RuQaD Crawler
Motivation
The Crawler reuses functionality of the LinkAhead crawler:
- Declarative creation of data objects from structured input data.
- Idempotent and context sensitive scan-create-and-insert-or-update procedures.
This functionality is extended by a custom converters and data transformers.
Contained Building Blocks
- Crawler wrapper: Calls the LinkAhead crawler on the files given by the RuQaD monitor, with the correct settings.
- CFood declaration: Specification of how entities in BatCAT shall be constructed from input data.
- Identifiables declaration: Specification of identifiying properties of entities in BatCAT.
- Converter: Custom conversion plugin to create resulting (sub) entities.
- Transformer: Custom conversion plugin to transform input data into properties.
Crawler wrapper
Purpose / Responsibility
The crawler wrapper scans files in specific directories of the file system and synchronizes them with the LinkAhead instance. Before insertion and updates of Records in LinkAhead, a meta data check is carried out to verify whether the meta data that was exported from kadi4mat is compatible with the target data model (in LinkAhead and the EDC). Validation failure leads to specific validation error messages and prevents insertions or updates of the scan result. The software component also carries out a check of data FAIRness of the data exported from kadi4mat (in ELN format).
Interface(s)
The crawler uses:
- A cfood (file in YAML format) which specifies the mapping from data found on the file system to
Recordsin LinkAhead. - A definition of the identifiables (file in YAML format) which defines the properties that are needed to uniquely identify
Recordsof the data model in LinkAhead. - The data model definition (file in YAML format). This is needed by the crawler to do the meta data check.
- Crawler extensions specific to the project (cusotm converters and custom transformers). These are python modules containing functions and classes that can be referenced within the cfood.
The interface is a Python-function that is implemented as a module into the RuQaD demonstrator. The function calls the scanner and main crawler functions of the LinkAhead crawler software.
Directory / File Location
Source code:
- Main interface:
ruqad/src/ruqad/crawler.py - Crawler extensions:
- Custom converters (currently not used):
ruqad/src/ruqad/crawler-extensions/converters.py - Custom transformers:
ruqad/src/ruqad/crawler-extensions/transformers.py
- Custom converters (currently not used):
Fulfilled Requirements
- Data ingest from exported ELN file into LinkAhead.
- Data ingest from quality check into LinkAhead.
- Check of FAIRness of data from ELN file.
- Meta data check
Runtime View
- The monitor continually polls the Kadi4Mat server for new items.
- Each new item is sequentially passed to the Demonstrator 4.2 quality checker for data quality checks and the crawler component for metadata FAIRness evaluation before being inserted into the target dataspace at BatCAT.

